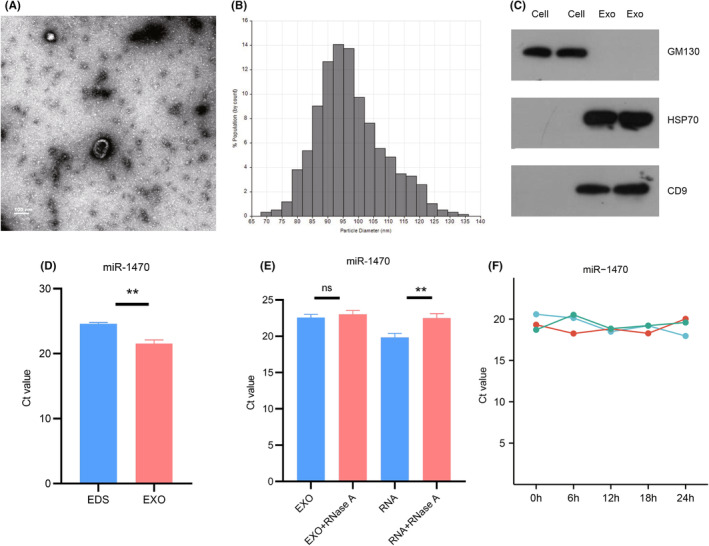
FIGURE 2.

Identification of exosomes and characterization of serum exosome miR‐1470 (A) TEM images showing exosomes isolated from serum of CRC patients. (Scale bar: 100 nm; high voltage (HV) = 80 kV). (B) Plasma exosomes were detected based on the qNano system, and the diameters were mainly distributed between 80 and 120 nm. (C) GM130 and exosomal protein markers: CD9 and HSP70. (D) Expression levels of miR‐1470 in serum exosomes (EXO) and exosome clearance supernatant (EDS). (E) qRT‐PCR analysis of the expression levels of miR‐1470 in the exosomes or isolated nucleic acids treated with RNase A. (F) Expression levels of miR‐1470 in serum exosomes at different incubation times at room temperature (**p < 0.01; ****p < 0.0001. EDS, exosome‐depleted supernatant; EXO, Exosomes; ns; not significant).
