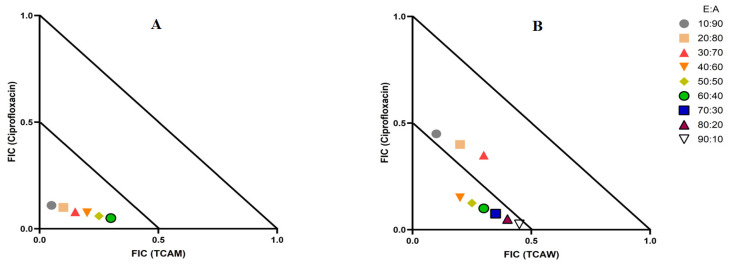
Figure 2.
(A) Isobologram analysis of the TCAM and ciprofloxacin combination when tested at multiple ratios against E. coli; (B) Isobologram of ratios of TCAW extract in combination with ciprofloxacin against K. pneumoniae. FIC values are displayed as the means of two independent repeats (n = 2). Ratio = % extract: % antibiotic. Values below the 0.5/0.5 line represent synergy; the segment between the 0.5/0.5 and 1/1 lines represents additive interactions. Only the synergistic and additive ratios are displayed in these graphs.

