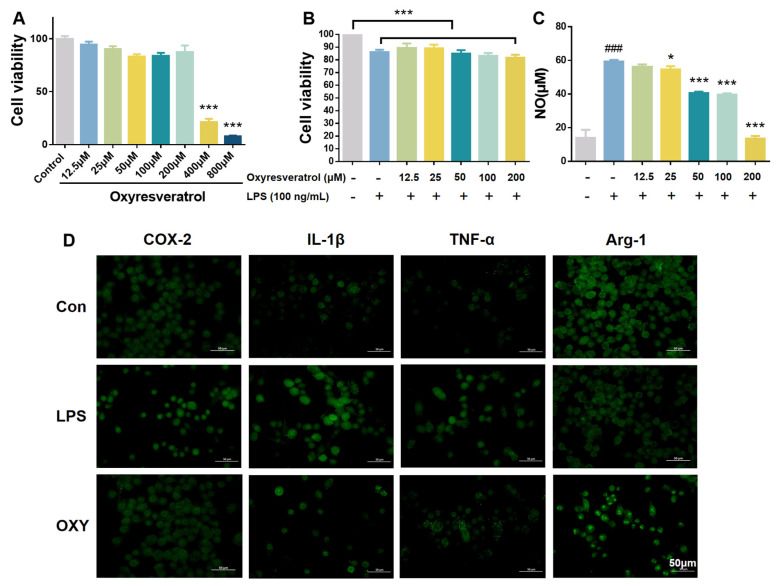
Figure 2.
OXY inhibited NO release and altered the M1/M2 polarization markers on BV−2 microglia. (A,B) The cytotoxicity of OXY on BV−2 cells. (C) The inhibitory effect of OXY on NO production. (D) OXY modulated phenotype polarization markers on BV−2 cells (M1: IL−1β and TNF−α; M2: Arg−1). All values are mean ± S.D. (n = 4). * p < 0.05, *** p < 0.001 versus model group, ### p < 0.001 versus control group. One−way ANOVA followed by Tukey’ s comparison test.

