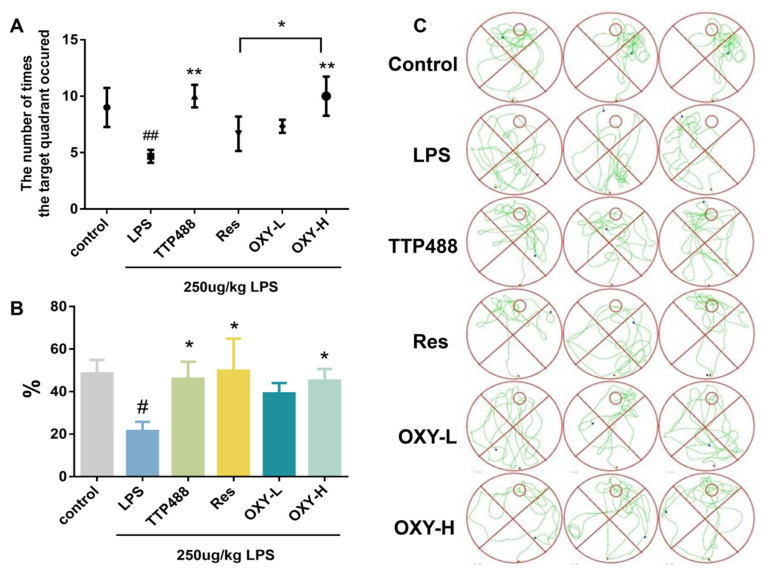
Figure 4.
OXY cognitive impairments and behavioral deficits in LPS−induced mice (space exploration experiment). (A) The frequency of crossing the target quadrant. (B) The ratio of swimming time spent in the target quadrant. (C) The trajectories of space exploration. All values are mean ± S.D. (n = 6), * p < 0.05, ** p < 0.01 versus LPS group, # p < 0.05, ## p < 0.01 versus control group. One-way ANOVA followed by Tukey’ s comparison test.

