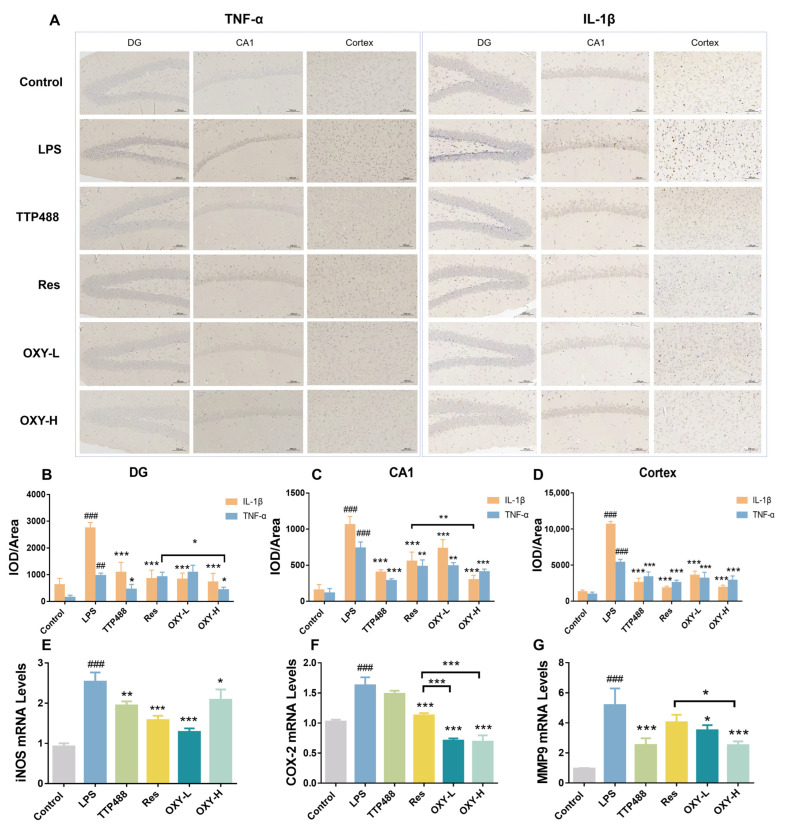
Figure 7.
The expression levels of inflammatory factors in the mouse brains. (A–D) The expression of TNF−α and IL−1β were measured by IHC; (E–G) The mRNA levels of iNOS, COX−2 and MMP9 were measured by RT−PCR. All values are mean ± S.D. (n = 3), * p < 0.05, ** p < 0.01, *** p < 0.001, treatment groups versus LPS group, ## p < 0.01, ### p < 0.001, LPS group versus control group. One−way ANOVA followed by Tukey’ s comparison test.

