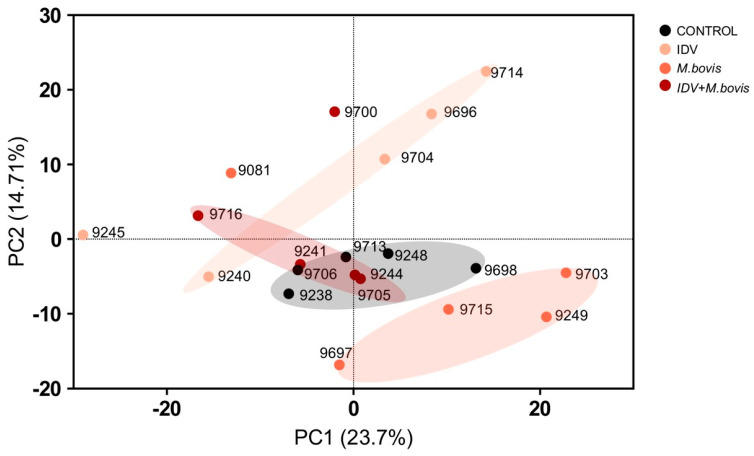
Figure 1.
Proteomic principal component analysis (PCA) plot illustrating the distribution of bronchoalveolar proteome in calves at 2 dpi. The black, pink, orange, and red dots correspond to the BAL samples of the controls, IDV−, M. bovis− and IDV+M. bovis-infected calves, respectively, and are labeled with the calf identity number.

