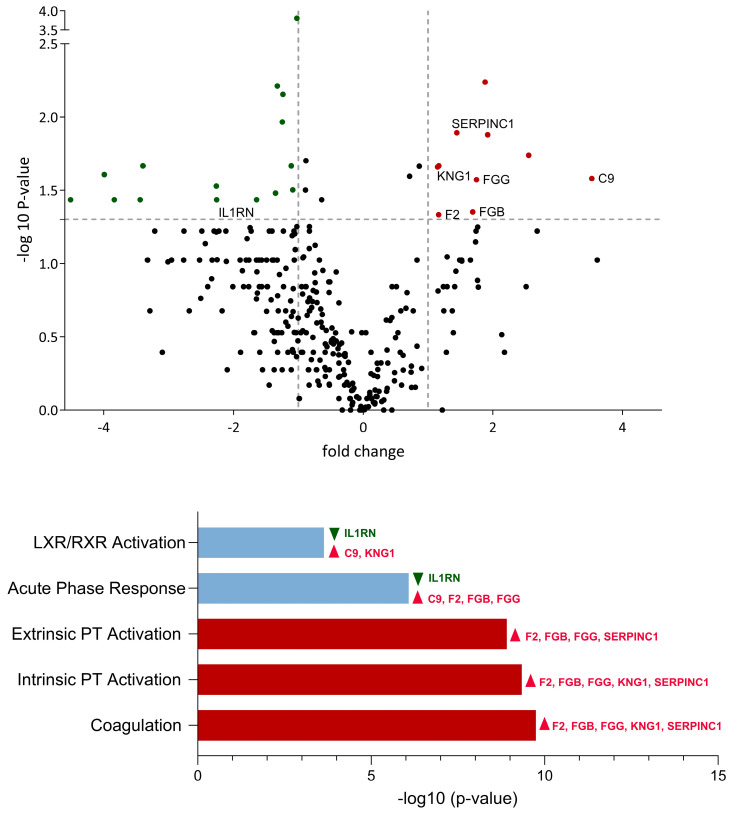
Figure 3.
Comparative analysis of protein expression and associated biological pathways in bronchoalveolar lavage of M. bovis-infected calves vs. controls. Upregulated proteins and pathways are illustrated in red, whereas downregulated proteins and pathways are represented in green. Pathways exhibiting both upregulated and downregulated proteins are indicated in light blue. The proteins involved in the top-five significantly affected pathways are named with their gene name. All illustrated proteins are listed in the supplementary information (Supplement S1).

