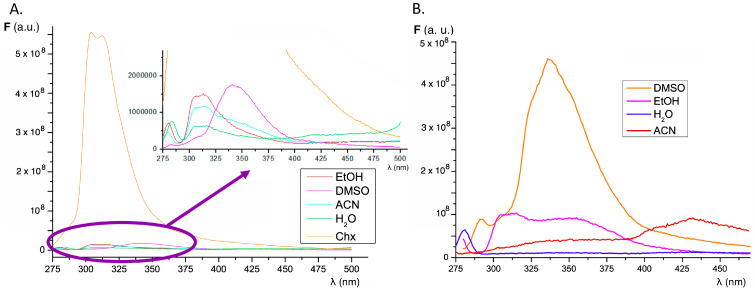
Figure 2.
Effect of solvent polarity on the fluorescence emission spectra of compound 1 (A) and compound 2 (B) at maximum excitation wavelength corresponding to each solvent (Table S3). The inset shows the expanded view of the spectra in order to compare the magnitude of the fluorescence emission intensity in different solvents.

