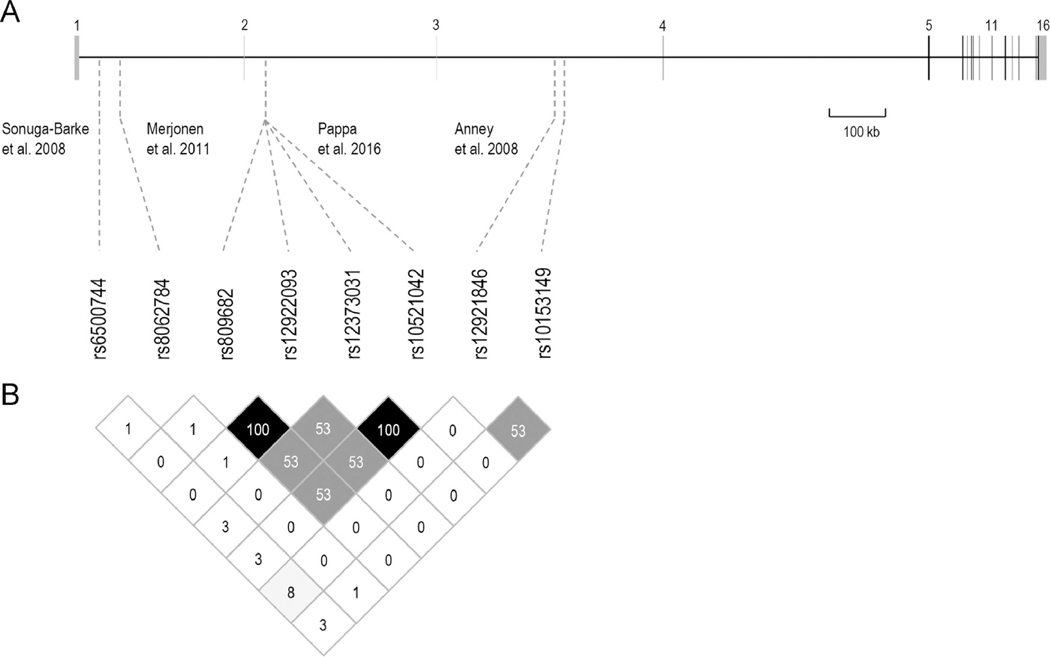
Figure 1.
A) Diagram of the human RBFOX1 gene (NM_018723, GRCh38 Chr16: 6,019,131–7,713,338). Solid boxes indicate exons, with the coding regions in black and the non-coding ones in grey. Exon numbering is shown on top of the figure. Eight SNPs found nominally associated with aggressive phenotypes in several genome-wide association studies (GWAS) are shown below, with their locations indicated by discontinuous lines. B) Linkage disequilibrium (LD) plot of the SNPs considering r2, according to Haploview 4.2. Black boxes indicate complete LD and grey is for moderate LD.

