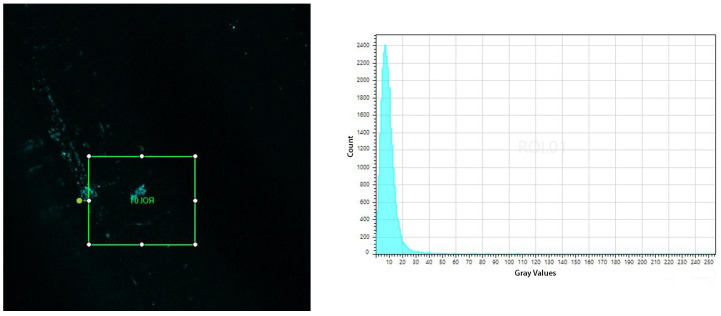
Figure 9.
(Left) Micrograph of a 3D reconstruction of the DAPI-labeled POF immunosensor after 10 min in the bacterial suspension of 104 CFU/mL. The inserted square represents the area of 1.6 × 105 µm2 at 10x magnification, submitted to the evaluation of fluorescence intensity. (Right) Graph of the fluorescence intensity distribution of the evaluated area.

