
Fig. 1 |. LOY is associated with a worse prognosis for men with MIBC.
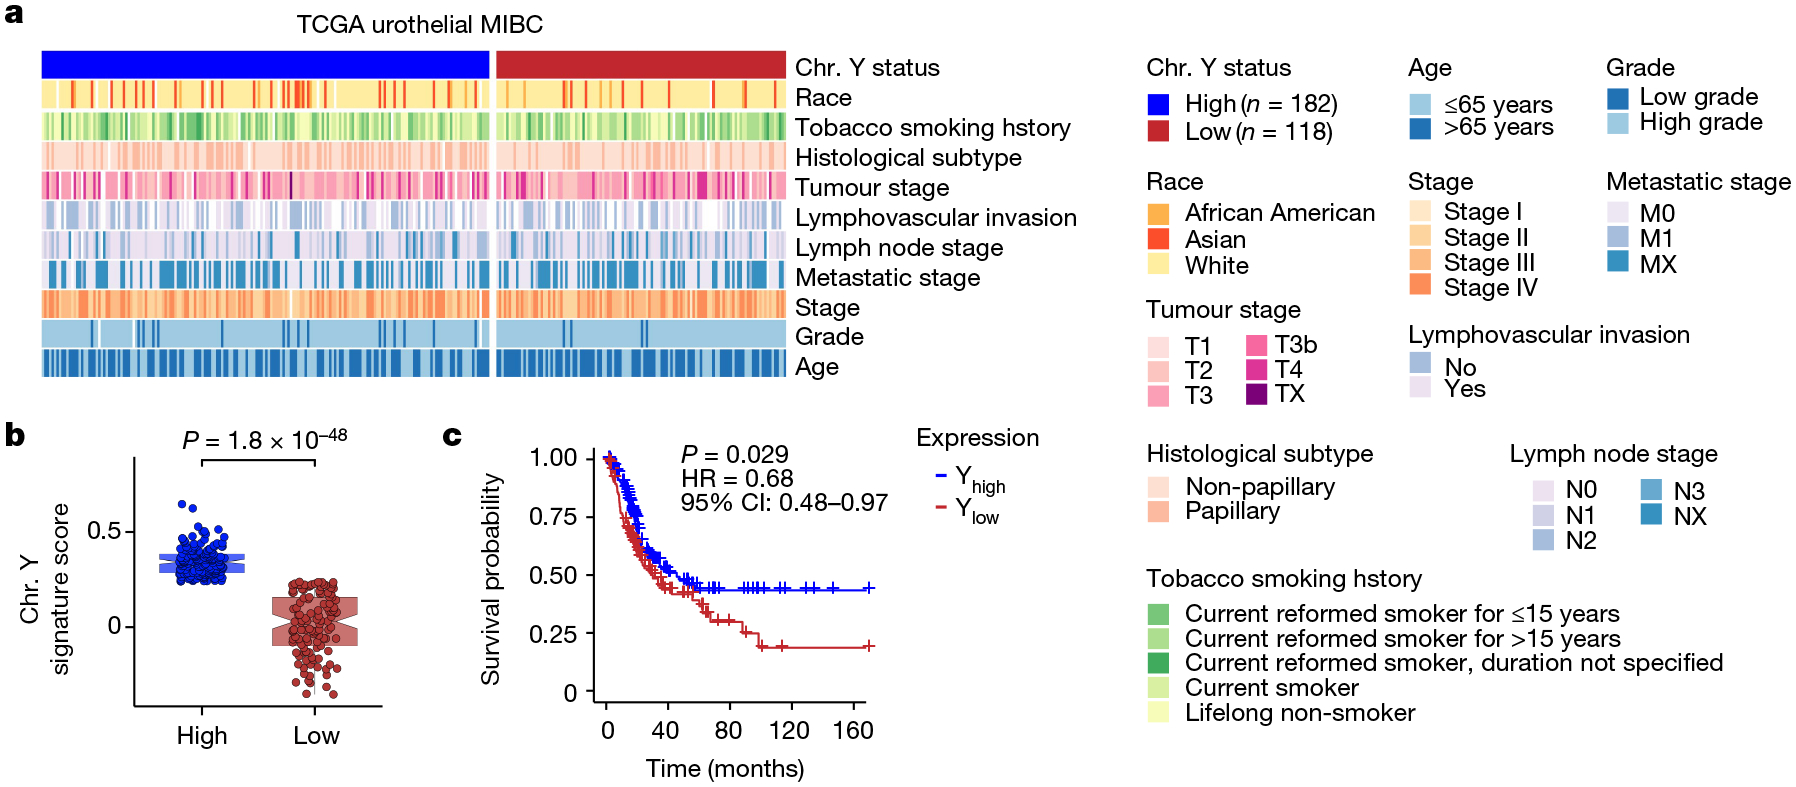
a, Heat map of clinical parameters and metadata for 300 male patients with MIBC from TCGA data. Chr. Y, Y chromosome. b,c, Plot of Y chromosome gene expression (b) and Kaplan–Meier survival curve (c) associated with Yhigh (n = 182) and Ylow (n = 118) samples identified in a. CI, confidence interval; HR, hazard ratio. Differences in gene expression and survival were based on Wilcoxon rank-sum test and log-rank statistics, respectively. In box plots, the centre line represents the mean and box edges show first and third quartiles. Minimum and maximum datapoints are included.