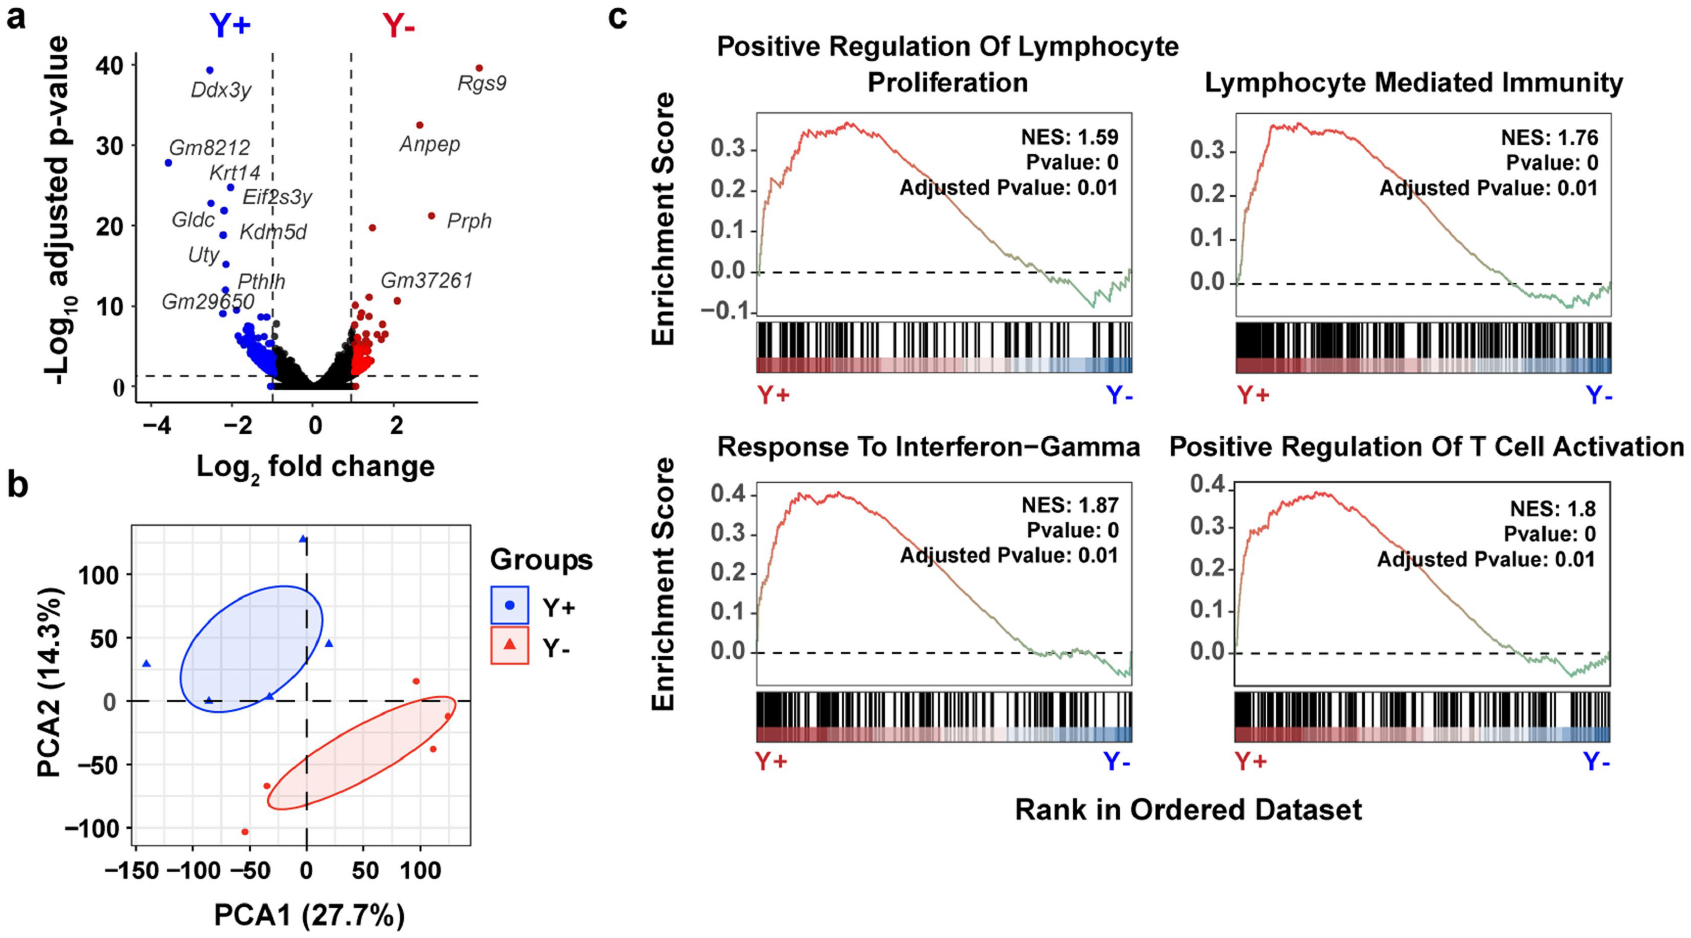
Extended Data Fig. 4 |. Increased lymphocyte activation in Y+ tumors.

a, Volcano plot of DEGs from bulk RNA isolated from Y+ and Y− MB49 tumors grown in male WT mice. Blue (Y+ tumors) and red (Y− tumors) genes correspond to statistically significant (Benjamini-Hochberg method, P < 0.05) genes that have a | >1 log2 | fold-change in expression. b, PCA of DEGs described in a. c, Gene ontology (GO) pathway enrichment score plots of statistically significant gene set enrichment analyses (GSEA) using DEGs from a. NES, normalized enrichment score.
