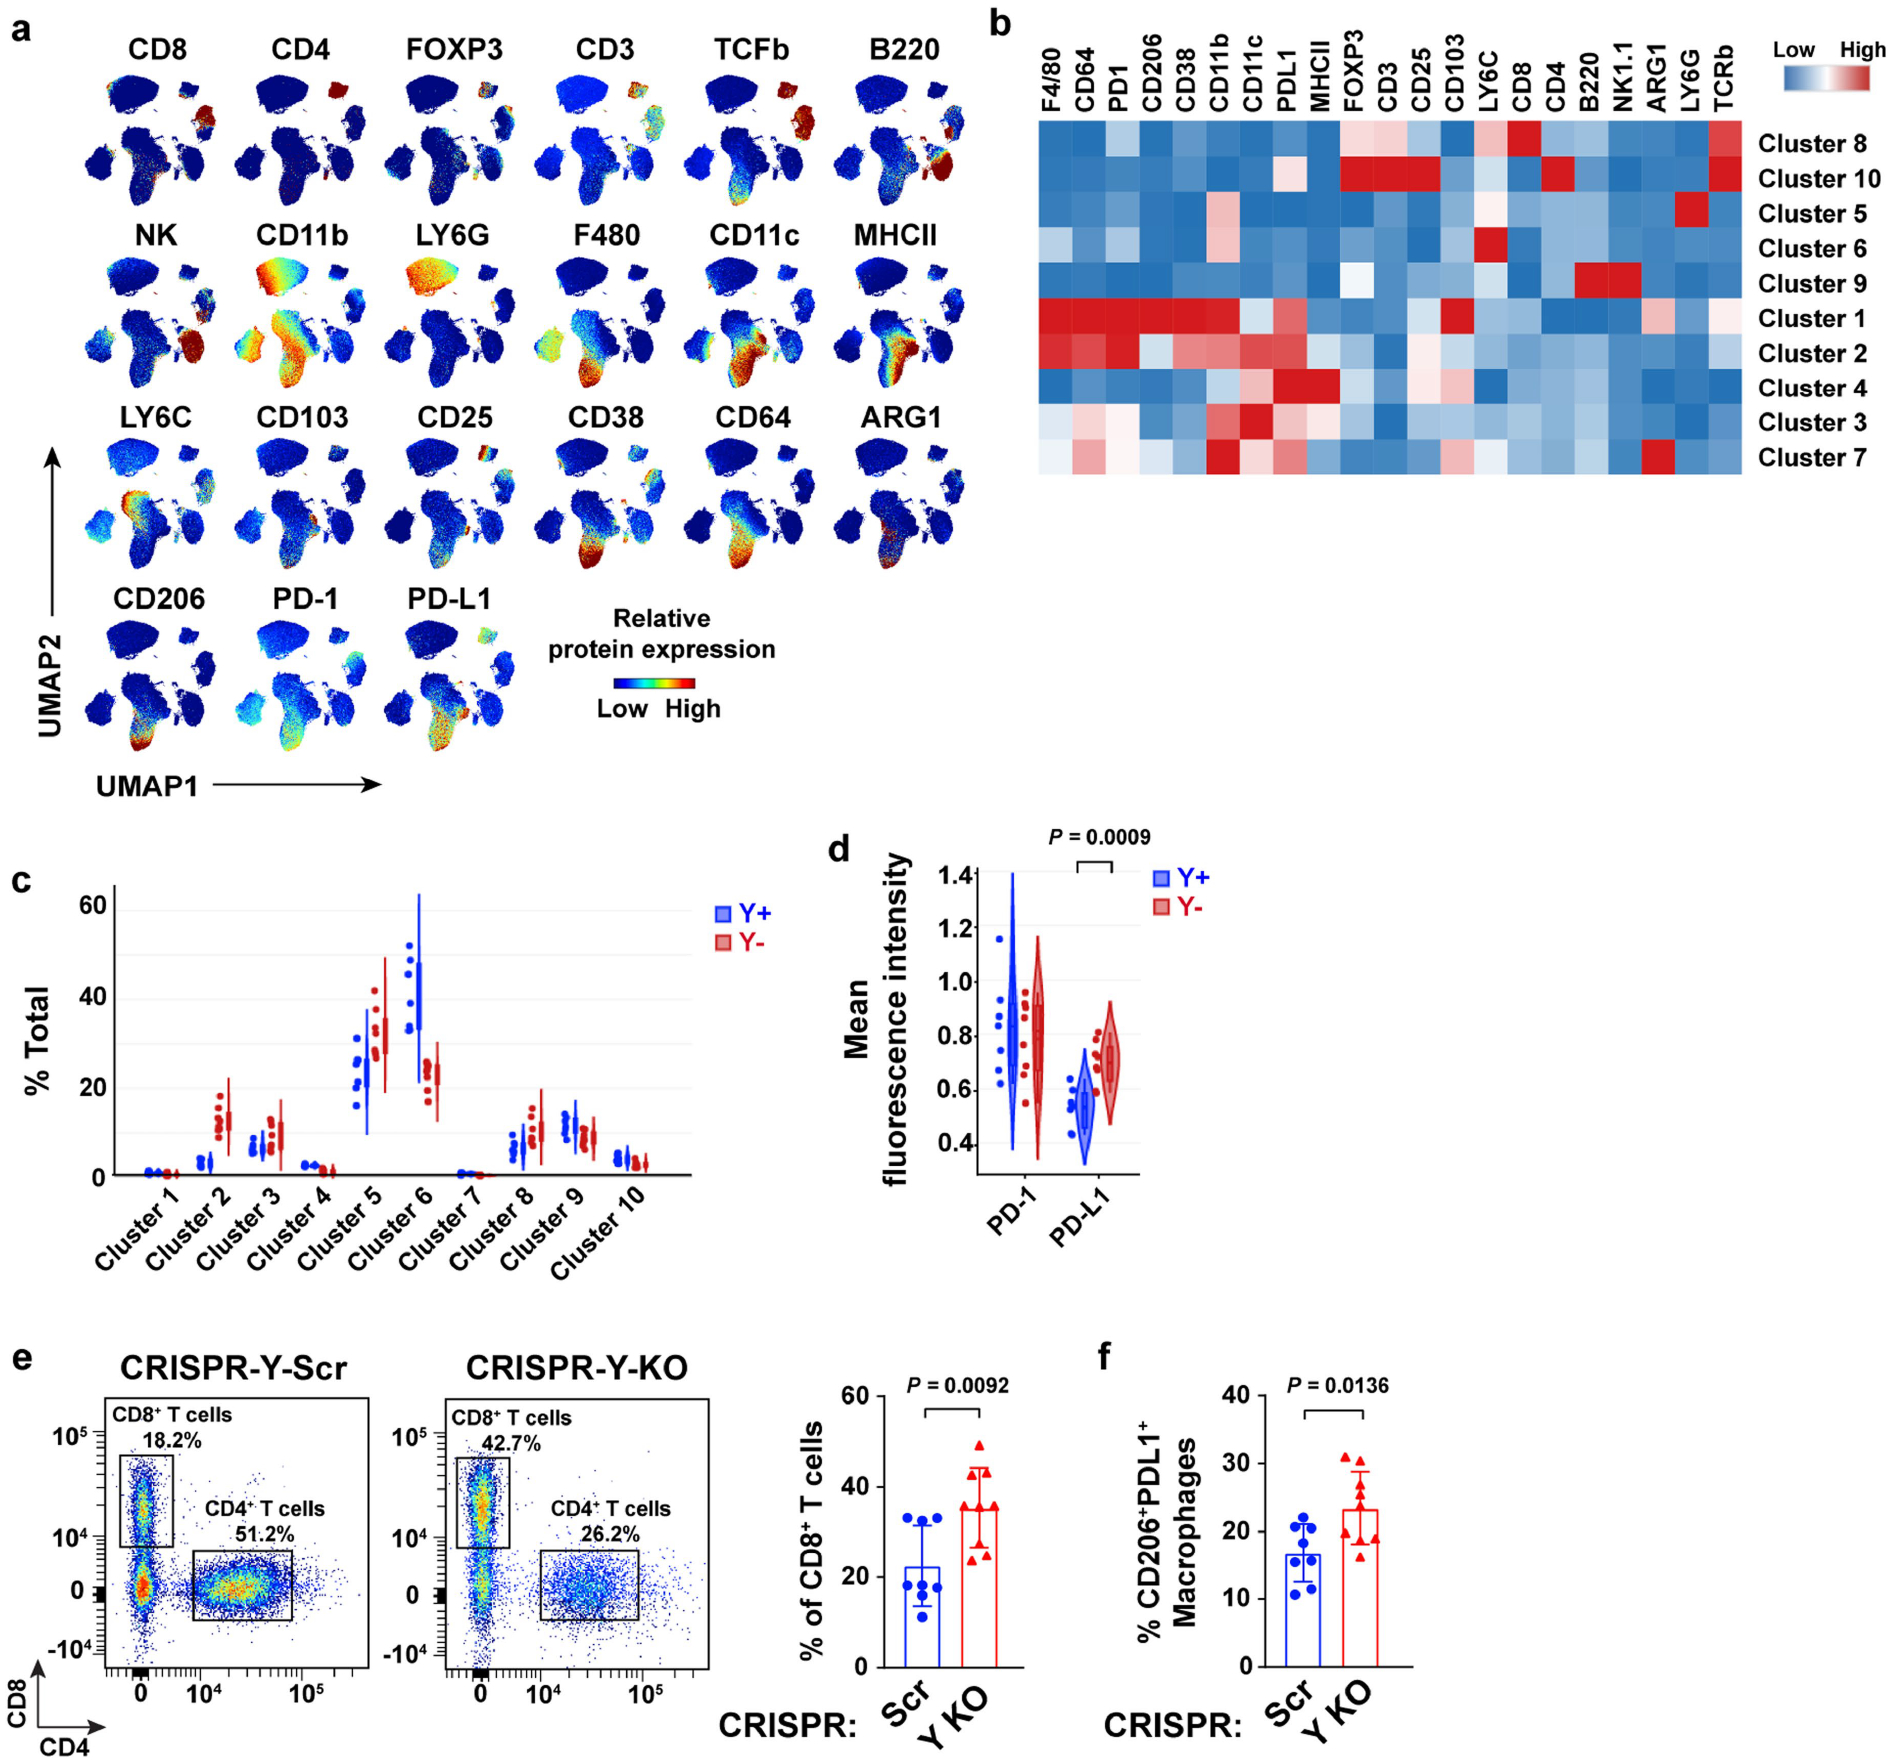
Extended Data Fig. 5 |. Comprehensive immune phenotyping of tumor-infiltrating leukocytes (TILs) in Y+ and Y− MB49 tumors.

a, UMAPs demonstrating individual spectral flow cytometry analysis of protein marker expression in CD45+ immune cells isolated from Y+ and Y− MB49 tumors grown in WT male mice. b, Heatmap of relative protein expression from immune cells described in a. c, Violin plots of each tumor sample across each cluster from the CD45+ immune cell UMAP (see Fig. 3b). d, Violin plot of PD-1 and PD-L1 mean fluorescence intensity in CD45+ immune cells from Y+ and Y− MB49 tumors. e, Representative dot plots and percentages of CD8+ and CD4+ T cells gated on total CD3+ T cells from CRISPR-Y-Scr (n = 8) and CRISPR-Y-KO (n = 9), MB49 tumors grown for 22 or 17 days, respectively, in male WT mice (left panels). Percentage of CD8+ T cells of total CD3+ T cells per tumor sample (right panel). f, Percentage of CD206+PDL1+ macrophages among total CD11b+F4/80+ macrophages from Control and Y KO MB49 tumors described in e. Statistics were determined using two-sided unpaired t-tests.
