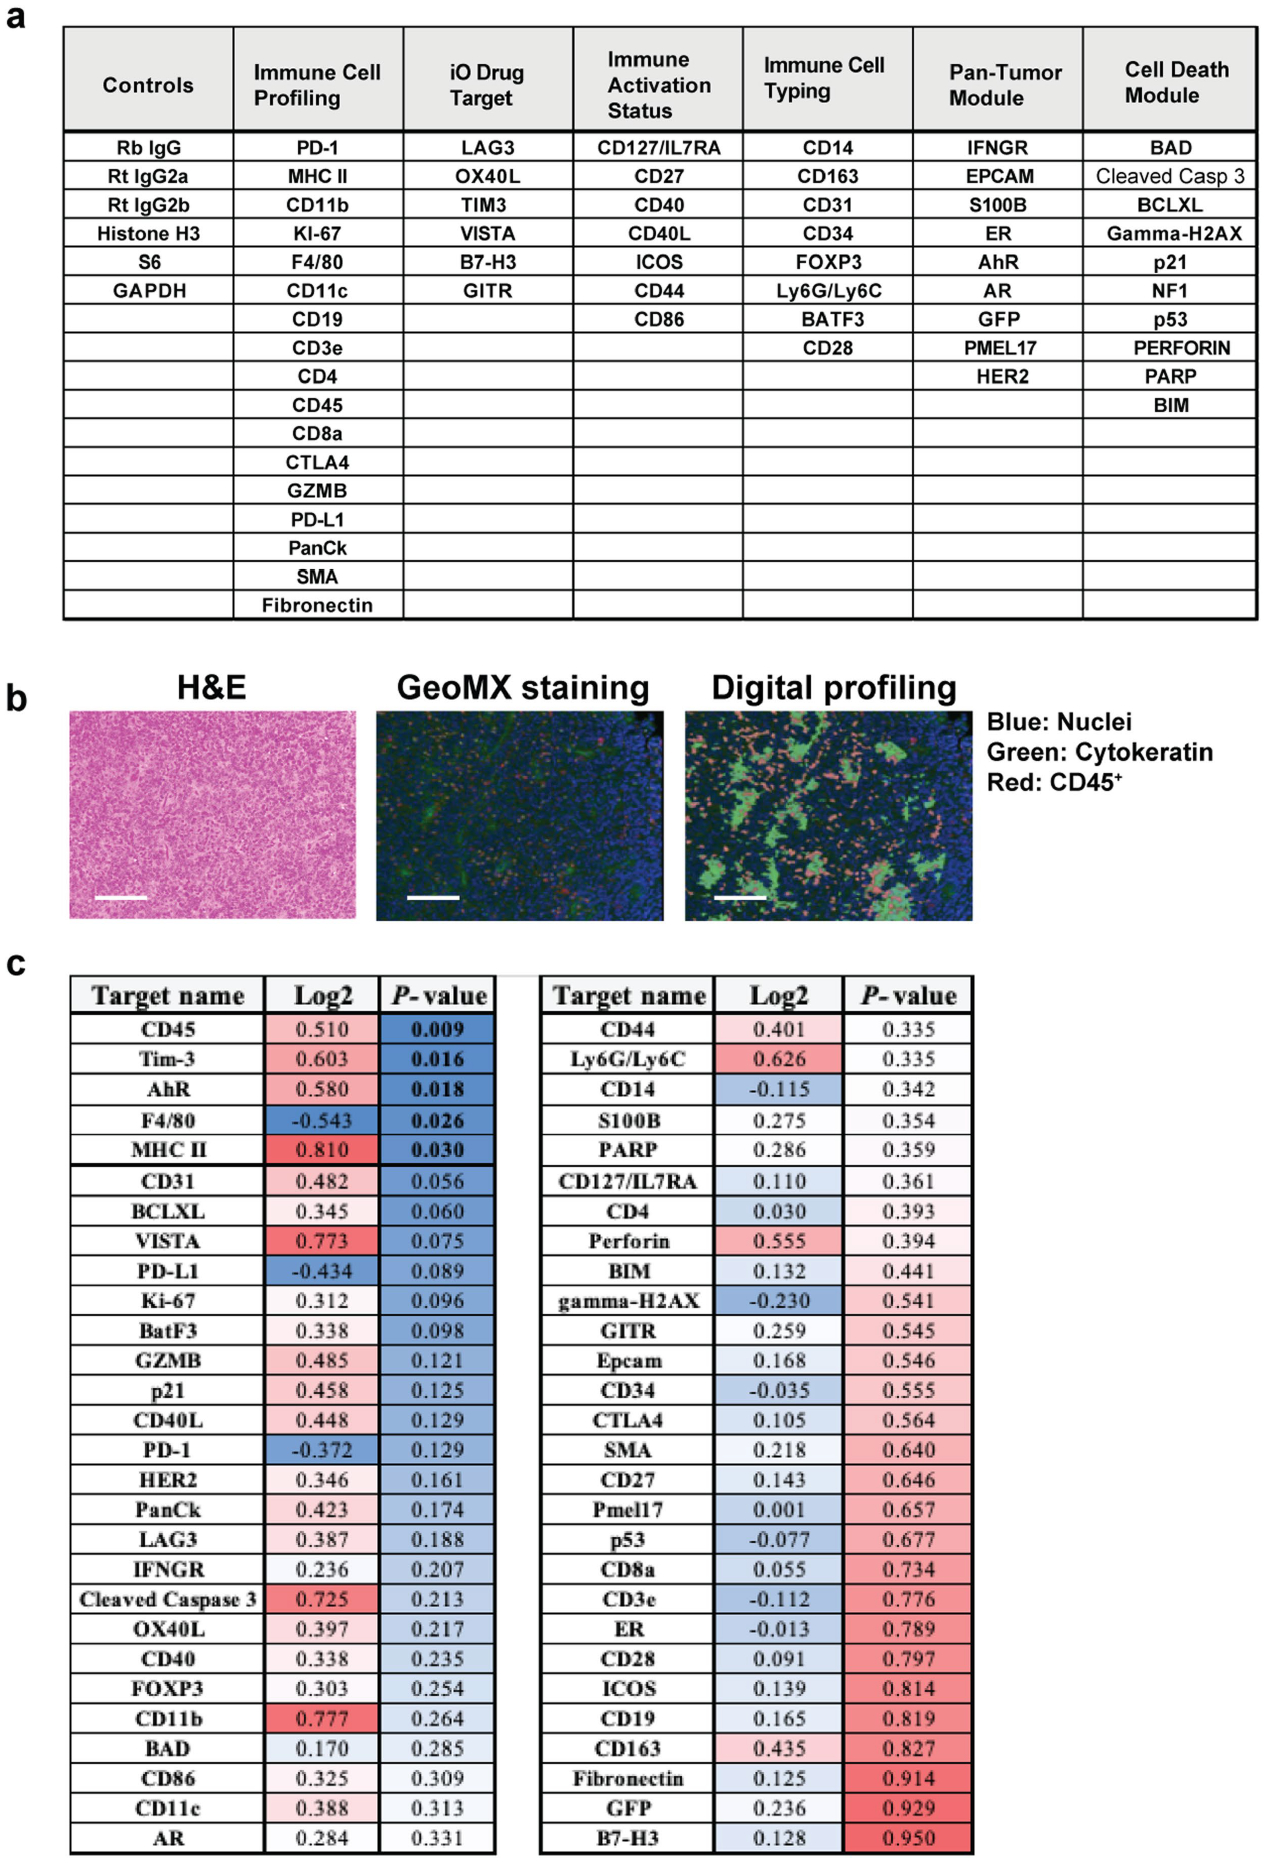
Extended Data Fig. 6 |. GeoMX histological evaluation of infiltrating immune cells in Y− and Y+ MB49 tumors.

a, Table of markers that are functionally categorized for GeoMX evaluation of Y+ and Y− MB49 tumors. b, Representative H&E image (left), immunofluorescence detection of nuclei (blue), cytokeratin (green), CD45+ immune cells (red) (middle), and associated computational digital profiling (right) to quantify markers shown in a. Scale bar, 125 μM. c, Quantification (log2 fold change and P-value) of the markers listed in Y+ versus Y− MB49 tumors (n = 10 tumors per group and three TMA cores per tumor). Data representative of two independent experiments. Statistical significance was determined by two-sided unpaired t-test.
