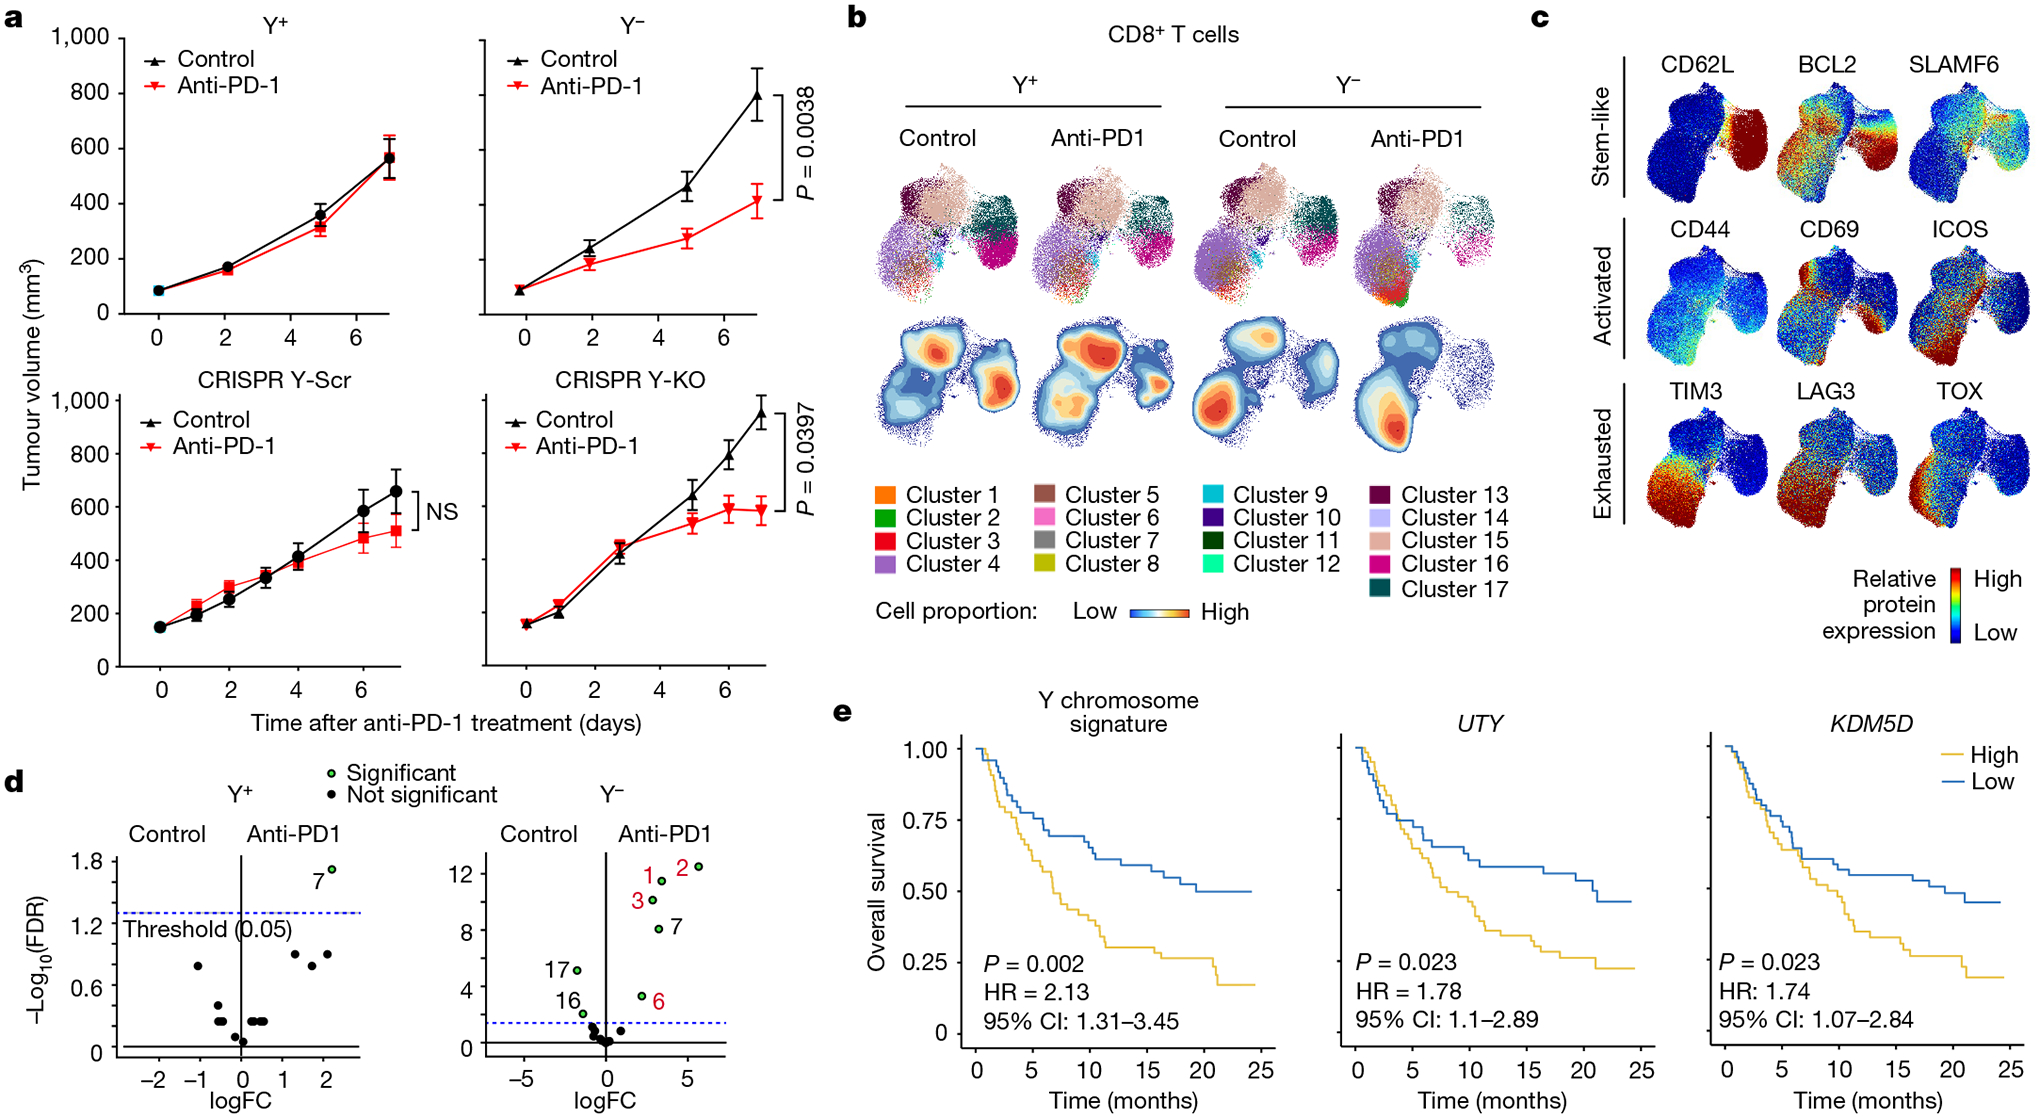
Fig. 5 |. Improved response of Ylow bladder cancer to anti-PD-1 ICB therapy.

a, Tumour growth curves of Y+ and Y− (top) and CRISPR Y-Scr and CRISPR Y-KO (bottom) treated with 200 μg anti-PD-1 antibody or isotype control IgG. Y+ isotype: n = 17 mice; Y+ anti-PD-1: n = 17 mice; Y− isotype: n = 14 mice; Y− anti-PD-1: n = 16 mice. Data representative of two independent experiments. CRISPR Y-Scr isotype: n = 11 mice; CRISPR Y-Scr anti-PD-1: n = 11 mice; CRISPR Y-KO isotype: n = 15 mice; CRISPR Y-KO anti-PD-1: n = 15 mice. Repeated measures two-way ANOVA. Data are mean ± s.e.m. NS, not significant. b, UMAPs of CD8+ T cell spectral flow cytometry results from Y+ and Y− MB49 tumours seven days after treatments described in a. The UMAPs report cluster analyses (top) and cell proportions (bottom). c, UMAP heat maps of individual protein markers for stem-like, activated and exhausted T cells superimposed on the UMAPs in b. d, Volcano plot of statistically significant (green) UMAP clusters between isotype and anti-PD-1-treated Y+ and Y− MB49 tumours. e, Left, Kaplan–Meier curves for patients with Yhigh and Ylow bladder cancer treated with anti-PD-L1, from the IMvigor210 dataset. Kaplan–Meier curves for patients with bladder cancer stratified by expression of UTY (centre) and KDM5D (right). Survival differences are based on log-rank statistics.
