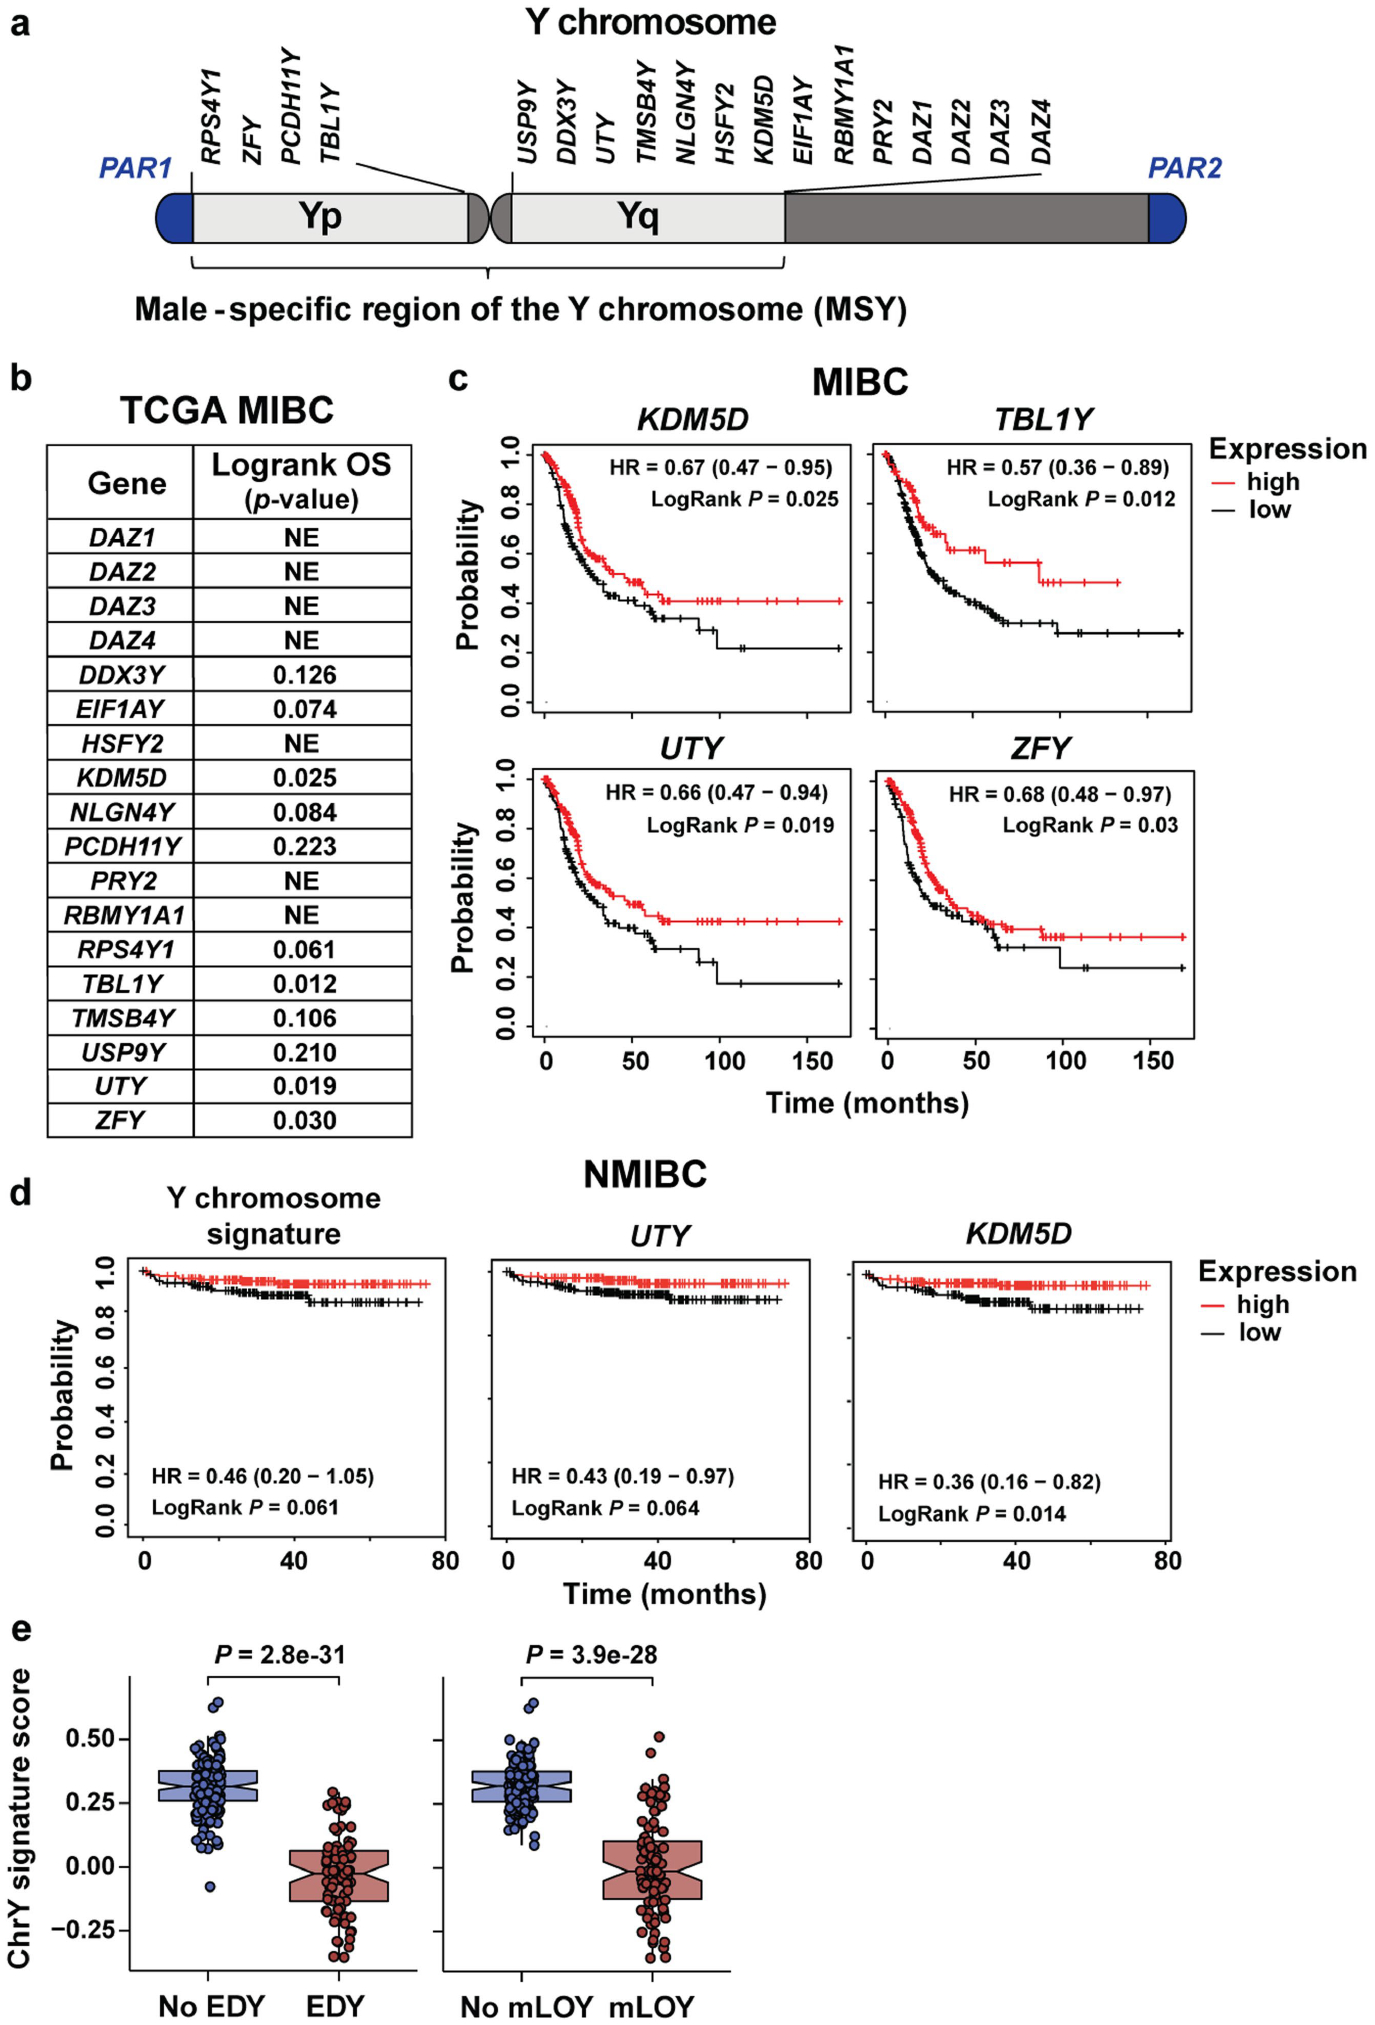
Extended Data Fig. 1 |. LOY is associated with a worse clinical outcome for patients with MIBC and NMIBC.

a, Y chromosome genes expressed in normal bladder urothelium that were used to create a Y chromosome gene expression signature. b, Logrank p-values based on stratification by Y chromosome gene expression (normalized FPKM) on TCGA MIBC patient overall survival (OS). Genes resulting in statistically significant OS are plotted in panel c. NE, not expressed. c, Kaplan-Meier plots of OS from TCGA data for males with MIBC and either high or low KDM5D, TBL1Y, UTY (KDM6C), or ZFY expression. d, Kaplan-Meier survival curves stratified by the Y signature score or expression levels for UTY and KDM5D in NMIBC from the E-MTAB-4321 cohort. Survival differences are based on Logrank statistics. e, ChrY gene expression signature scores of TCGA data plotted with respect to extreme downregulation of chromosome Y (EDY, left panel) and Mosaic Alteration Detection for LOY (mLOY, right panel) levels. Statistical significance was determined by Wilcoxon rank-sum test (NoLOY n = 151, LOY n = 90, NoEDY n = 165, EDY n = 76). Boxplots represent the mean with first and third quartile data. Minimum and maximum datapoints are included.
