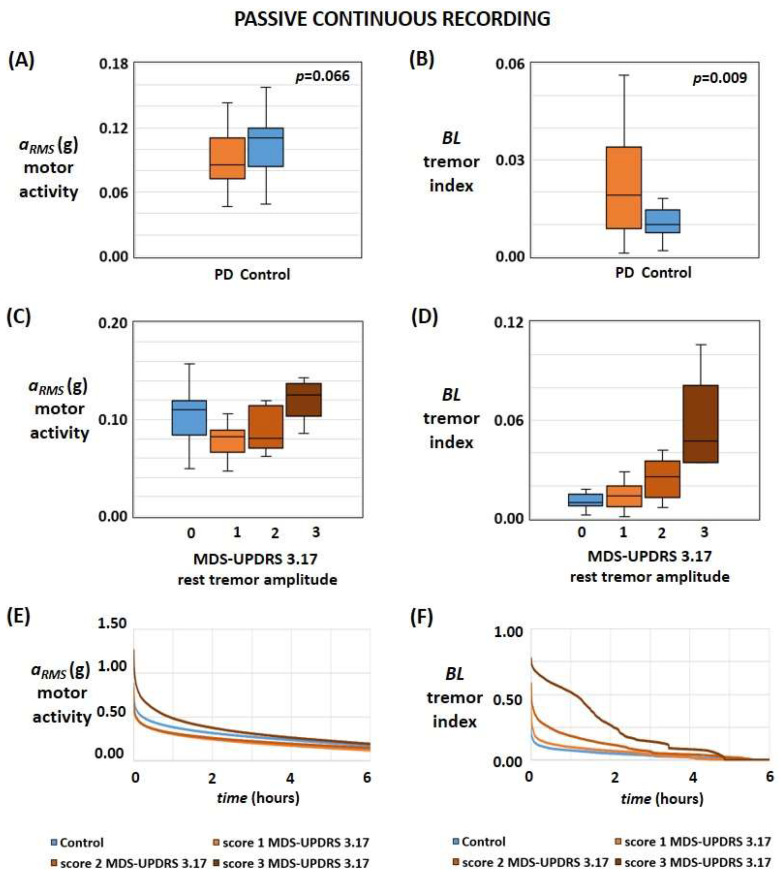
Figure 1.
Results of passive continuous monitoring for each motor feature. (A,B) Box plot of motor activity (A) and tremor index (B) in healthy controls and PD patients. (C,D) Box plots of motor activity (C) and tremor index (D) in healthy subjects and PD patients with different severities of rest tremor. (E,F) The average temporal pattern of the motor activity (E) and tremor index (F) was determined during the 24-h recordings; for each recruited subject, values were sorted from the highest to the lowest value, and then the average value for each rest tremor severity was computed by considering all of the subjects with the same score of the item 3.17 of MDS-UPDRS.

