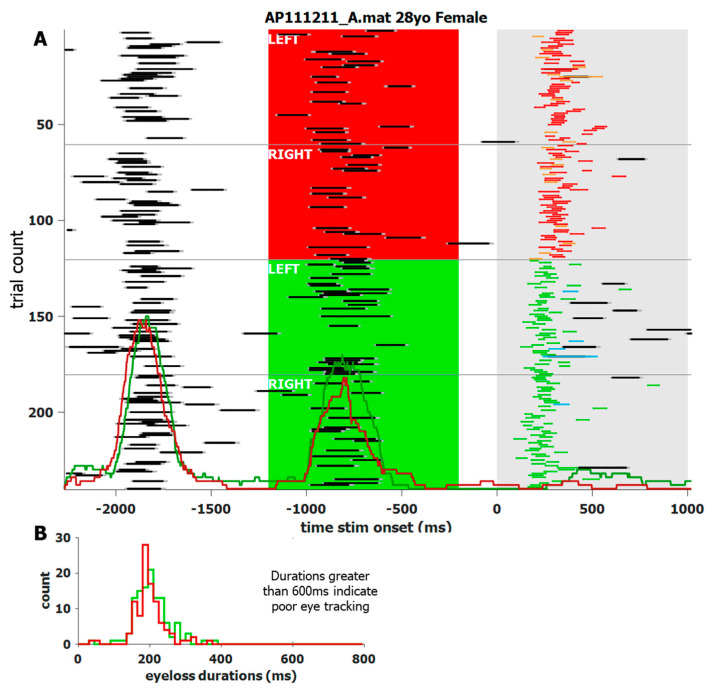
Figure 4.
Screen shot of a custom application to visualize the blink behavior of a single participant with a high blink rate. (A) trial-by-trial recap of what transpired. The trials start with the ITI, followed by the colored FIX, and then the STIM onset at 0 ms. The trials are re-ordered by task (ANTI above PRO) and STIM location (left above right), and are indicated by white text. Data loss is indicated by black lines, bordered by dark grey, to indicate the full blink length. Task related saccades, between 90 and 800 ms, are color-coded to match Figure 1. Red and green histograms overlaid in (A) indicate probability, not just onset, of a blink for ANTI and PRO saccades, respectively. Their heights are proportional to the number of total trials. Red and green histograms overlaid in (B) indicate blink duration by task.

