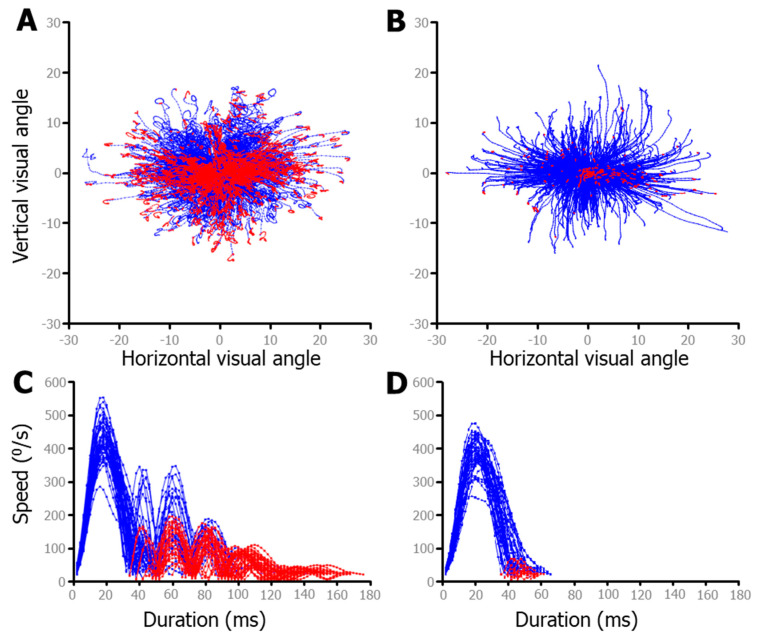
Figure 6.
Fixed saccade mapping (FSM) above-speed plots of free-viewing data from two participants. Red data indicate the part of the saccade after the speed dropped below the threshold, but due to post saccadic slosh, motion continued. Some individuals exhibit much more mobility of the iris, leading to greater post-saccadic slosh. (A). The participant showing the most post-saccadic slosh. (B). The participant exhibiting the least post-saccadic slosh. (C,D) Speed plots for a sample of each individual’s (directly above) saccades. To ensure comparison of similar saccades, only rightward saccades made within ±22.5° of 0° and with amplitudes from 8 to 12° were plotted in (C,D).

