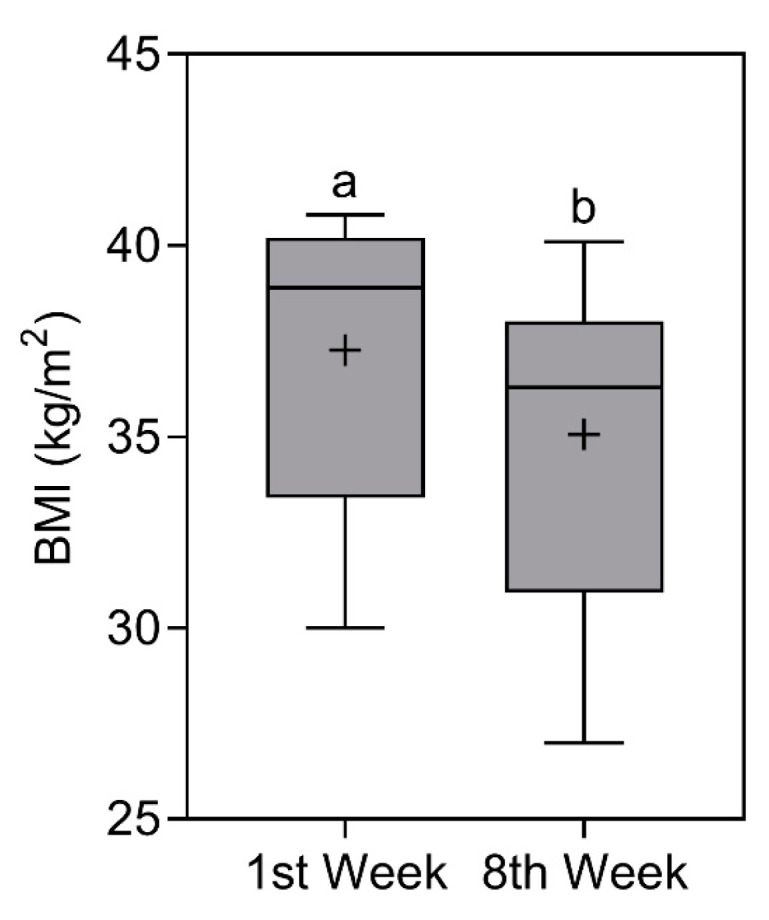
Figure 3.

Body mass index (BMI) of study participants in the first and eighth week. Data presented as median (central boxplot line), mean (plus sign), interquartile range (lower box limit for Q1 and upper box limit for Q3), minimum (lower whisker), and maximum (upper whisker). Different superscript letters indicate a significant difference between the BMI observed in the first and eighth week (Wilcoxon test; p < 0.0001).
