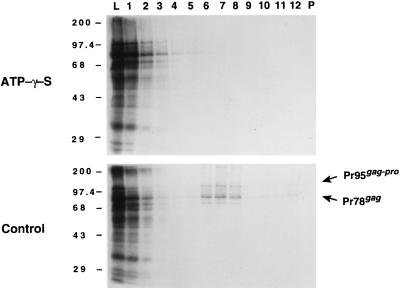
FIG. 5.
Sucrose gradient analysis of M-PMV gag and gag-pro programmed in vitro translations. Equal volumes of gradient fractions were separated by SDS-PAGE (10% polyacrylamide gel) and visualized by fluorography. Lane numbers represent the gradient fractions beginning from the top (lane 1). Lane L contained an equivalent aliquot of the translation reaction mixture which was loaded onto each gradient; lane P contained the material which had pelleted in the tube. The electrophoretic positions of the molecular mass protein markers are indicated in kilodaltons on the left, and the positions of Pr78gag and Pr95gag-pro are shown on the right. The translation reactions which were treated with ATPγS (top panel) or H2O (control; bottom panel) are indicated.

