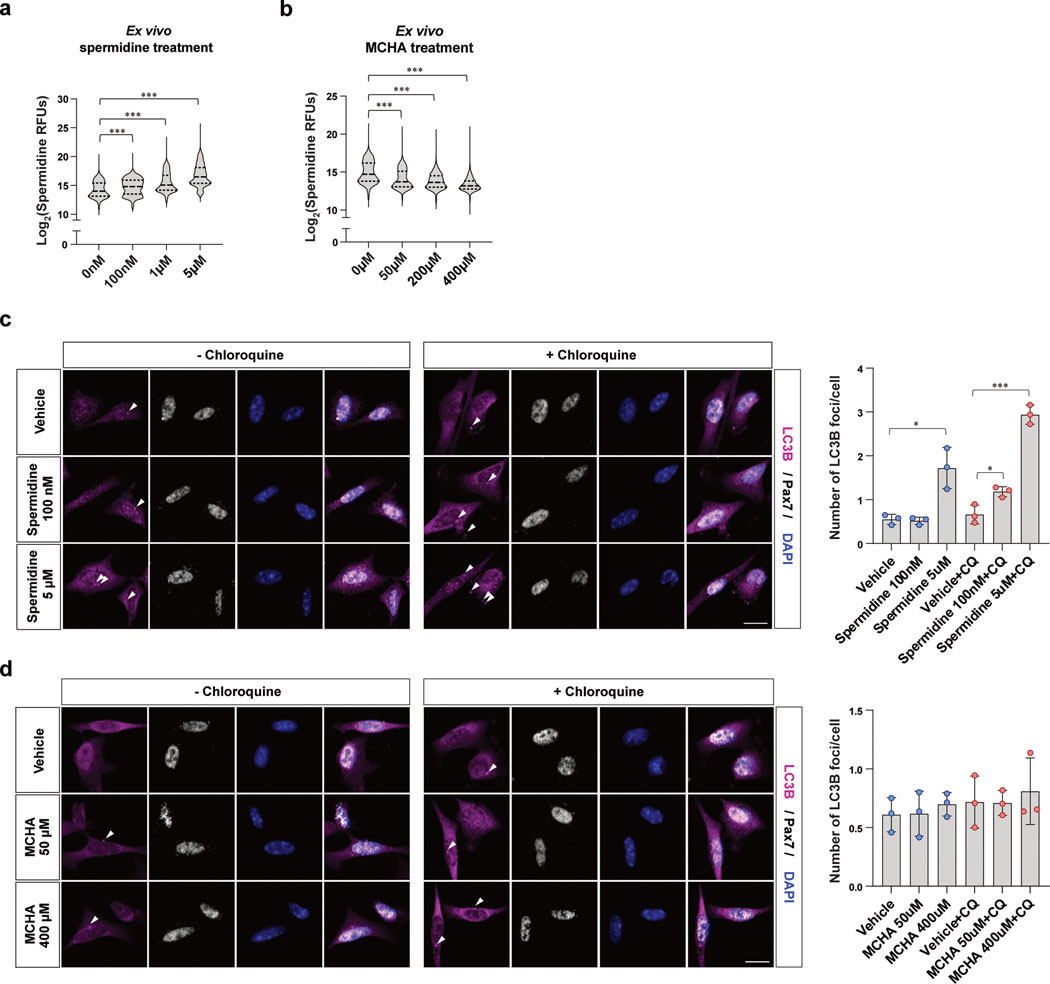
Extended Data Fig. 5. Inhibiting spermidine synthesis does not impair autophagy of aged MuSCs.
a-b, Quantification of intracellular spermidine levels. Violin plots showing RFUs of spermidine in old MuSCs treated with each dose of spermidine (a) or MCHA (b) as indicated (n=3). c-d, (Left) Representative confocal immunofluorescence images of old MuSCs treated with vehicle or each dose of spermidine (c) or MCHA (d) for 48 hr. In each case, cells were treated with or without 50 μM of chloroquine (CQ) for the last 3 hr of incubation. (Right) Quantification of number of LC3B foci per cell. (Scale bar, 10 μM) Data are shown as median and quartiles (a, b) and mean ± SD (c, d). P values were calculated by two-sided unpaired Student’s t-tests (a-d). *P < 0.05; **P < 0.01; ***P < 0.001.

