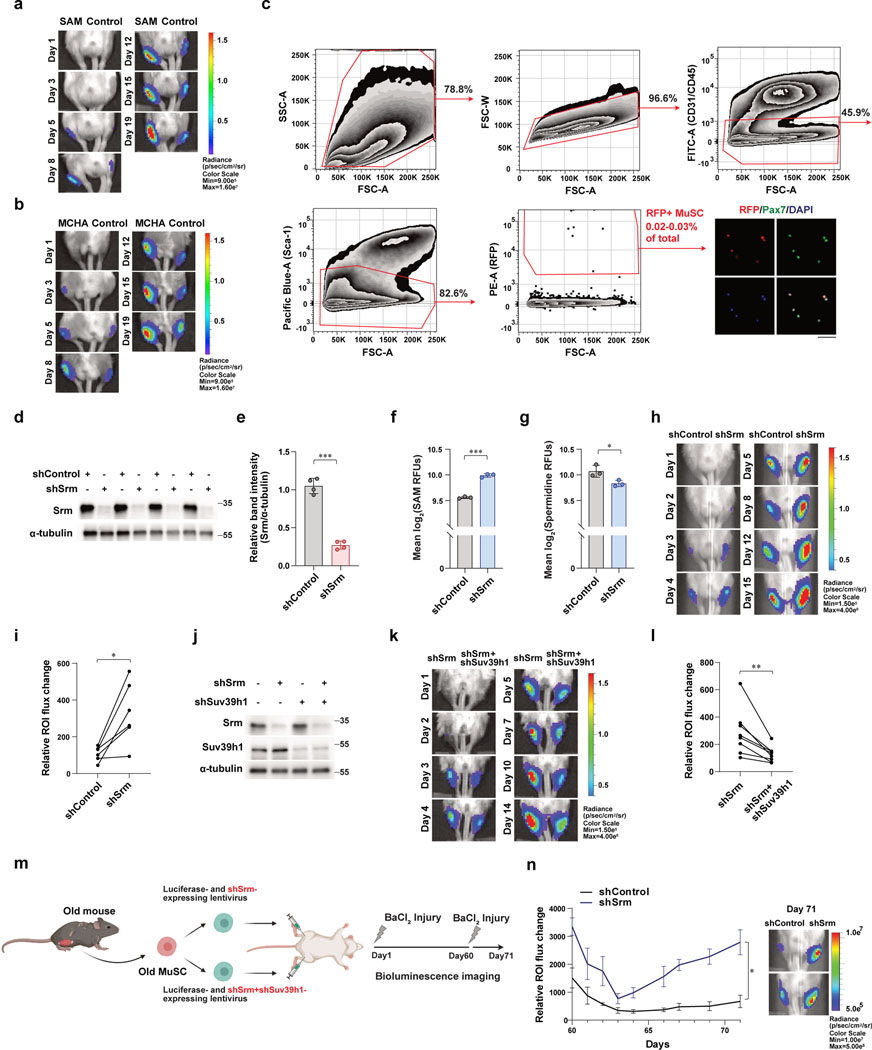
Extended Data Fig. 6. Restoration of SAM and H3K9 methylation improves in vivo potency of old MuSCs to regenerate new muscle.
a-b, Representative images of bioluminescence of vehicle- or SAM-treated MuSCs (a) and vehicle- or MCHA-treated old MuSCs (b) which had been transplanted into muscles of NSG mice. A day after transplantation is Day 1 (n=6). c, Representative FACS plots for analysis of RFP-positive MuSCs isolated from recipient NSG mice. Purity of isolated RFP-positive MuSCs is > 98% as assessed by staining for Pax7 of cells (Scale bar, 50 μm). d, Old MuSCs were transduced with shRNA containing lentiviruses as indicated. After 48 hr of culture, the cells were subjected to western blotting (n=4). e, Band intensity of Srm was normalized to the band intensity of α-tubulin (n=4). f-g, Old MuSCs transduced with shControl or shSrm were stained with antibodies against SAM (f) or spermidine (g). Mean RFUs of intracellular SAM or spermidine were quantified (n=3). h, Representative BLI images taken from Day 1 to Day 15. MuSCs transduced with shControl or shSrm were transplanted into muscles of NSG mice (n=6). i, Paired comparisons of relative bioluminescence flux measured from the right and left muscles of each mouse eight days after transplantation. j, Western blot analysis of SRM and SUV39H1 in MuSCs. Old MuSCs were transduced with shRNA containing lentiviruses as indicated. After 48 hr of transduction, the cells were subjected to western blotting (n=3). k, Representative BLI images of MuSCs transduced with shSrm or shSrm with shSuv39h1 which had been transplanted into muscles of NSG mice (n=8). l, Paired comparisons of relative bioluminescence flux measured from the right and left muscles of each mouse ten days after transplantation. m, Schematic of transplantation. n, (Left) Quantified results of BLI measured at different time points from 60 to 71 days following transplantation (n=6). (Right) Representative images of bioluminescence captured 71 days after transplantation. Data are shown as mean SD (e-g). P values were calculated by two-sided unpaired Student’s t-tests (e-g) and by one-sided student’s t test, pairwise between groups (i, l, n). *P < 0.05; **P < 0.01; ***P < 0.001.

