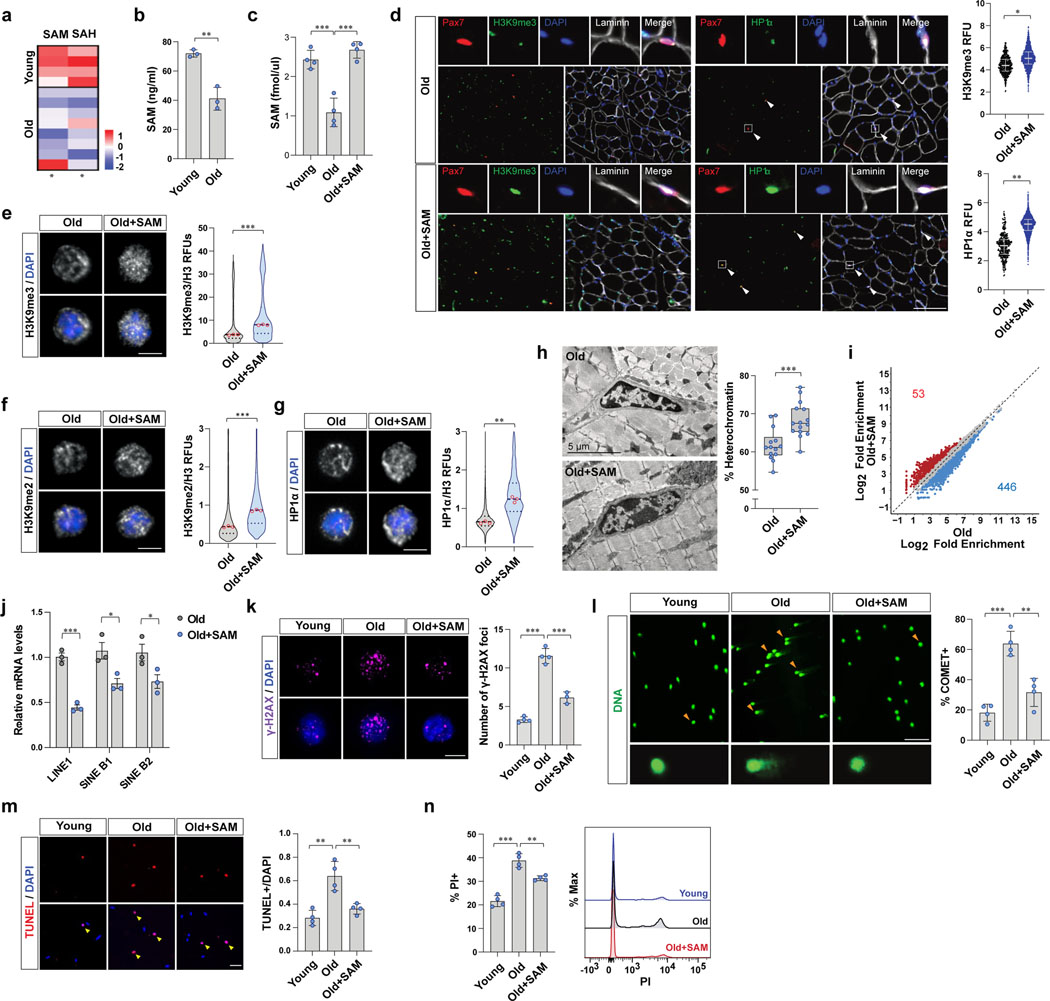
Figure 2. Restoration of SAM promotes heterochromatin formation and rescues dysfunctions of old MuSCs.
a, A heat map of relative levels of SAM and SAH detected by untargeted metabolomics based on LC-MS. b, SAM content of MuSCs measured by SAM ELISA (n=3). c, Quantitative LC-MS of SAM (n=4). d, (Left) Representative tissue immunostaining images of Pax7CreER;R26RRFP mice. (Right) RFUs of H3K9me3 and HP1α in RFP-positive MuSCs (Scale bar, 100 μm, n=4). e-g, (Left) Representative confocal immunofluorescence images (Scale bar, 1 μm). (Right) Violin plots showing RFUs of H3K9me3 (e), H3K9me2 (f), and HP1α (g), which were normalized to RFUs of total H3 (n=3). h, (Left) Representative TEM images (Scale bar, 5 μm). (Right) Quantification of heterochromatin cross-sectional area over total cross-sectional area of nucleus (n=14 cells examined over 3 independent animals per group). The box represents the IQR, with the lower and upper hinges indicating the 25th and 75th percentiles, respectively. The horizontal line inside the box marks the median. The whiskers extend to the minimum and maximum values. i, Differential ATAC-seq peaks were determined with different number of reads that exhibit an over 50%-fold change in signals (p-value< 0.05). j, The mRNA level of each TE was normalized to Gapdh (n=3). k, (Left) Representative confocal images (Scale bar, 5 μm). (Right) The number of γ-H2AX foci in a cell a day after irradiation (n=4 for young and old mice, n=3 for SAM-treated old mice). l, (Left) Representative images of cells after alkaline comet assay (Scale bar, 50 μm). (Right) The percentage of cells with DNA damage was quantified (n=4). m, A day after 7 Gy γ-irradiation, isolated MuSCs were cultured for 2 days. (Left) Representative images of TUNEL assay (Scale bar, 50 μm). (Right) The ratio of TUNEL positive MuSCs over total MuSCs (n=4). n, A day after 7 Gy γ-irradiation, isolated MuSCs were cultured for 2 days. (Left) The percentage of PI positive cells (n=4). (Right) Representative FACS plot. Data are shown as mean ± SD (b-c, j-n) and as median and quartiles (d-g). P values were calculated by two-sided unpaired Student’s t-tests (b-h, j-n). *P < 0.05; **P < 0.01; ***P < 0.001.

