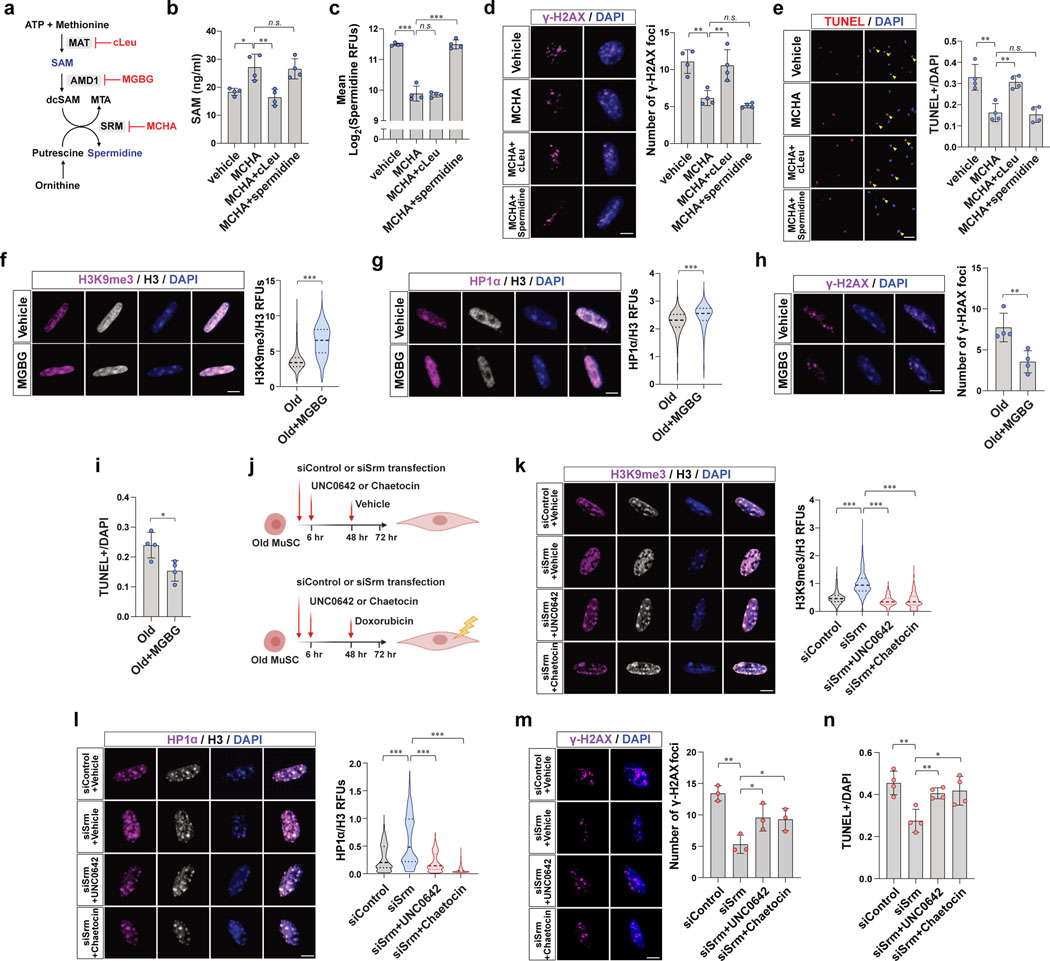
Figure 4. Heterochromatin re-formation by restoration of SAM ameliorates susceptibility to genotoxic stress and cell death in old MuSCs.
a, Diagram showing actions of cLeu, MGBG, and MCHA on the synthesis of SAM and spermidine. b, Old MuSCs were treated as indicated for 2 days. SAM was quantified by SAM ELISA (n=4). c, Mean RFUs of intracellular spermidine in old MuSCs treated as described in (b) (n=4). d, After treating old MuSCs as described in (b), 0.75 μM of doxorubicin was added to the media, and the cells were cultured for one more day. (Left) Representative confocal images of γ-H2AX foci (Scale bar, 5 μm). (Right) The ratio of γ-H2AX foci per cell (n=4). e, (Left) Representative TUNEL assay images of old MuSCs treated as indicated (Scale bar, 50 μm). (Right) The ratio of apoptotic cells over total cells was quantified (n=4). f-g, (Left) Representative confocal immunofluorescence images of old MuSCs treated with vehicle or MGBG for 48 hr (Scale bar, 5 μm). (Right) RFUs of H3K9me3 (f), or HP1α (g) were normalized to RFUs of total H3 (n=4). h, After treating old MuSCs with vehicle or MGBG, 0.75 μM of doxorubicin was added to the media, and the cells were cultured for one more day. (Left) Representative confocal images (Scale bar, 5 μm). (Right) The ratio of γ-H2AX foci per cell (n=4). i, The ratio of apoptotic cells over total cells (n=4). j, Timetable and procedure of ex vivo drug treatment of old MuSCs used in (k-n). k-l, (Left) Representative confocal images of MuSCs treated as described in (j) (Scale bar, 5 μm). (Right) RFUs of H3K9me3 (k) and HP1α (l) were normalized to RFUs of total H3 (n=4). m, (Left) Representative confocal images of γ-H2AX (Scale bar, 5 μm). (Right) Quantification of the number of damaged foci (n=3). n, The ratio of TUNEL positive cells over total cells was plotted (n=4). Data are shown as mean ± SD (b-e, h, i, m, n) and as median and quartiles (f, g, k, l). P values were calculated by two-sided unpaired Student’s t-tests (b-i, k-n). *P < 0.05; **P < 0.01; ***P < 0.001.

