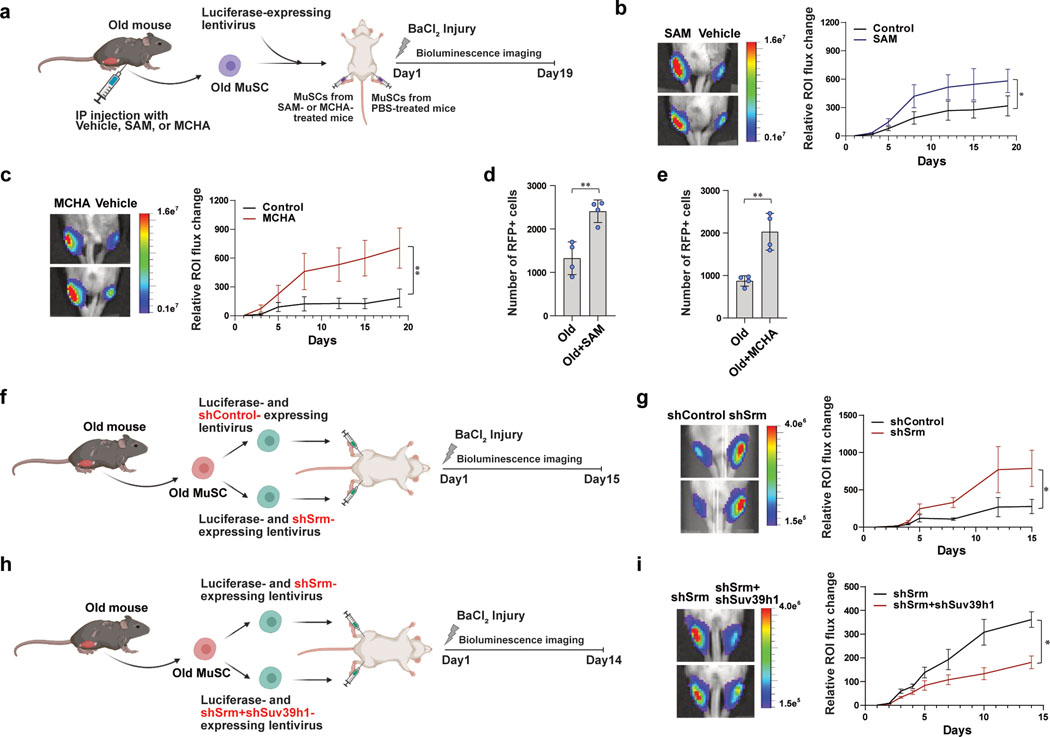
Figure 5. Restoration of heterochromatin improves in vivo potency of old MuSC to regenerate new muscle.
a, Schematic of MuSC transplantation. b, (Left) Representative images of BLI observed 19 days after transplantation. (Right) Quantified results of BLI measured at different time points up to 19 days following transplantation (n=7). c, (Left) Representative images of BLI observed 19 days after transplantation. (Right) Quantified results of BLI measured at different time points up to 19 days following transplantation (n=6). d-e, Quantification of number of RFP-positive MuSCs isolated from each transplanted TA muscle. The number of RFP-positive MuSCs isolated from SAM-treated (d) or MCHA-treated (e) mice was higher than that from vehicle-treated mice (n=4). f, Schematic of transplantation. Old MuSCs were transduced with sh-lentiviruses containing a control scrambled sequence (shControl) or a sequence targeting Srm (shSrm). TA muscles of NSG mice were injected with the MuSCs resuspended in BaCl2 and monitored for 15 days by BLI. g, (Left) Representative images of BLI captured 8 days after transplantation in TA muscles of NSG mice. (Right) Quantified results of BLI measured at different time points up to 15 days following transplantation (n=6). h, Schematic of transplantation. Old MuSCs were transduced with sh-lentiviruses containing a sequence targeting Srm (shSrm) or both Srm and Suv39h1 (shSrm+shSuv39h1). The cells were transplanted as indicated and monitored for 14 days by BLI. i, (Left) Representative images of bioluminescence captured 10 days after transplantation of MuSCs treated as described in (h). (Right) Quantified results of BLI measured at different time points up to 14 days following transplantation (n=8). ROI: Region Of Interest. Data are shown as mean ± SEM (b, c, g, i) and as mean ± SD (d, e). P values were calculated by one-sided student’s t test, pairwise between groups (b, c, g, i) and by two-sided unpaired Student’s t-tests (d, e). *P < 0.05; **P < 0.01; ***P < 0.001.

