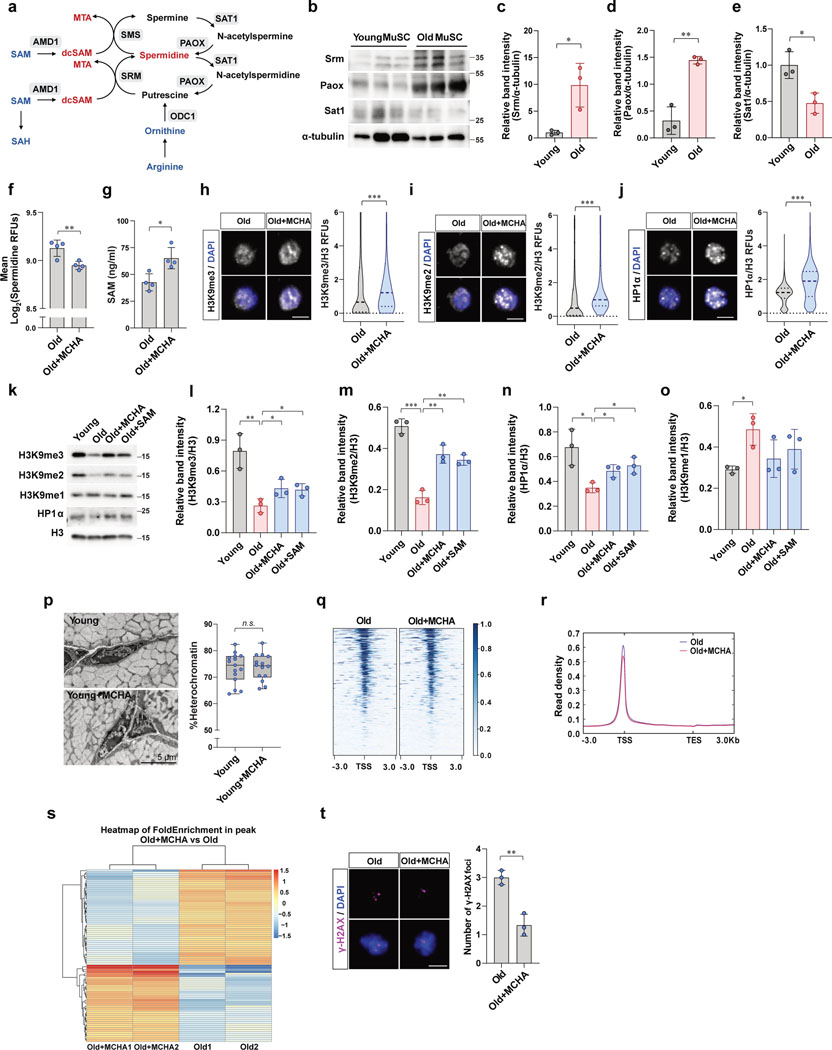
Extended Data Fig. 3. Inhibiting spermidine synthesis promotes heterochromatin re-formation and reduces DNA damage in old MuSCs.
a, Diagram of spermidine metabolism. The synthesis of spermidine and spermine requires dcSAM as aminopropyl donor, which is produced from SAM by AMD1. b, Representative Western Blots of SRM, PAOX, SAT1, and α-tubulin in MuSCs which were freshly isolated form young and old mice (n=3). c-e, Band intensities of SRM (c), PAOX (d), and SAT1 (e) were normalized to the level of α-tubulin (n=3). f, Quantification of RFUs of intracellular spermidine in MuSCs from vehicle- or MCHA-treated old mice (n=4). g, Intracellular SAM content of MuSCs measured by SAM ELISA (n=4). h-j, Representative confocal immunofluorescence images of MuSCs of old female mice treated with vehicle or MCHA (Scale bar, 5 μm). RFUs of H3K9me3 (h), H3K9me2 (i), or HP1α (j) were normalized to RFUs of total H3 (n=4). k, Representative western blots of H3K9me3, H3K9me2, H3K9me1, HP1α, and total H3 of MuSCs (n=3). l-o, Band intensities of H3K9me3 (l), H3K9me2 (m), HP1α (n), and H3K9me1 (o) were normalized to the band intensities of total H3 (n=3). p, (Left) Representative transmission electron microscopy images of MuSCs on EDL sections. (Right) The percentage of heterochromatin cross sectional area over total cross-sectional area of nucleus is quantified (n=15 cells examined over 3 independent young mice treated with vehicle, n=14 cells examined over 3 independent young mice treated with MCHA). The box represents the interquartile range, with the lower and upper hinges indicating the 25th and 75th percentiles, respectively. The horizontal line inside the box marks the median score. The whiskers extend to the minimum and maximum values. q, Representative heat maps of ATAC-seq tag intensity 3kb around TSSs. r, Read density within 3 kb upstream of TSSs and 3 kb downstream of the TESs. s, Hierarchical clustering of peak enrichment patterns. t, (Left) Representative confocal immunofluorescence images of γ-H2AX foci. (Right) Quantification of the number of γ-H2AX foci per cell (n=3). Data are shown as mean SD (c-g, l-o, t) and as median and quartiles (h-j, p). P values were calculated by two-sided unpaired Student’s t-tests (c-j, l-p, t). *P < 0.05; **P < 0.01; ***P < 0.001.

