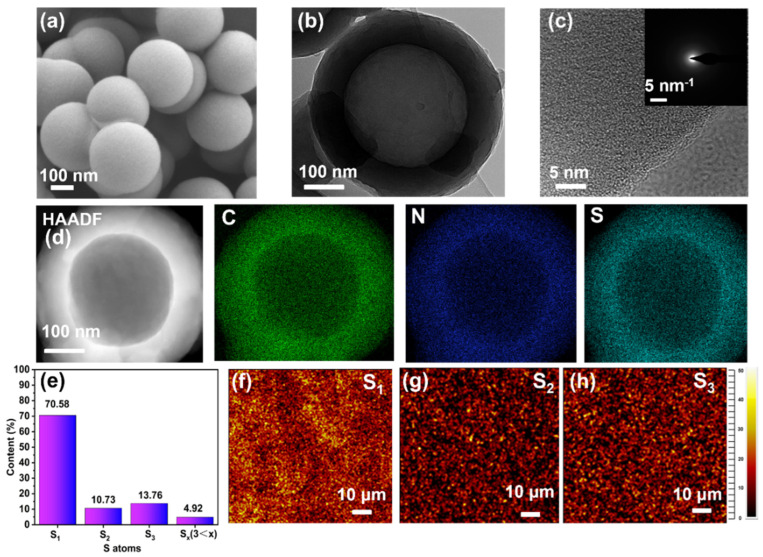
Figure 2.
Characterization of SHC-450. (a) SEM image, (b,c) TEM images at different magnifications of SHC-450. Inset of (c) is an SAED pattern. (d) C, N, and S element mapping images of SHC-450. (e) Contents of sulfur species of SHC-450 calculated based on the result of TOF-SIMS. (f–h) Intensity mapping of S1, S2, and S3.

