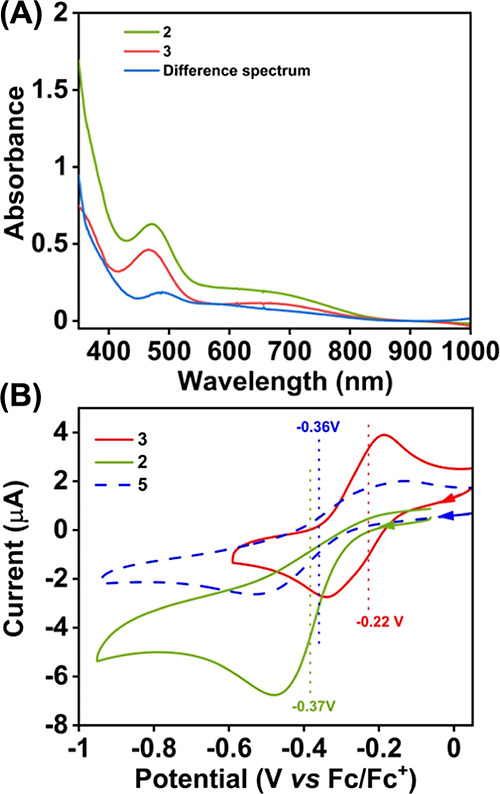
Figure 2.

(A) UV–vis spectra of 2 (0.16 mM) and 3 (0.15 mM) measured in acetonitrile at −45 °C. (B) Cyclic voltammograms of 2 (0.5 mM), 3 (0.5 mM), and 5 (0.5 mM) were measured in acetonitrile at −15 °C. A glassy carbon working electrode, a Pt wire counter electrode, and nBu4NPF6 as the supporting electrolyte were used during the measurements.
