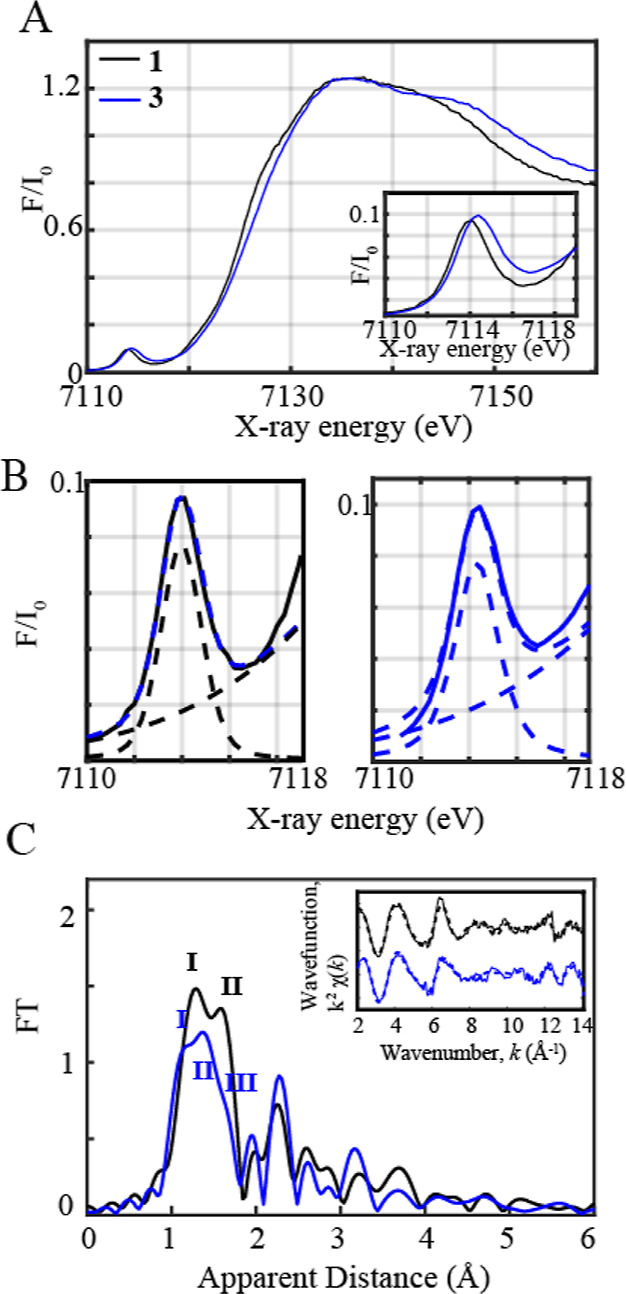
Figure 3.

(A) Normalized Fe K-edge XANES spectra recorded at 20 K of 1 shown in black together with 3 (shown in blue). Inset: zoom-in view of the pre-edge regions of 1 and 3. (B) Zoom-in view of the pre-edge regions together with the respective fits shown in dashed blue. The black and blue dashed lines correspond to the step and pseudovoigt functions used to fit the pre-edge peaks, respectively. (C) Fourier transforms of k2-weighted Fe EXAFS of 1 (in black) and 3 (blue). Inset: Back Fourier transformed experimental (solid lines) and fitted (dashed lines) k2χ(k) for 1 and 3. Experimental spectra were calculated for k values of 2–14.107 Å–1.
