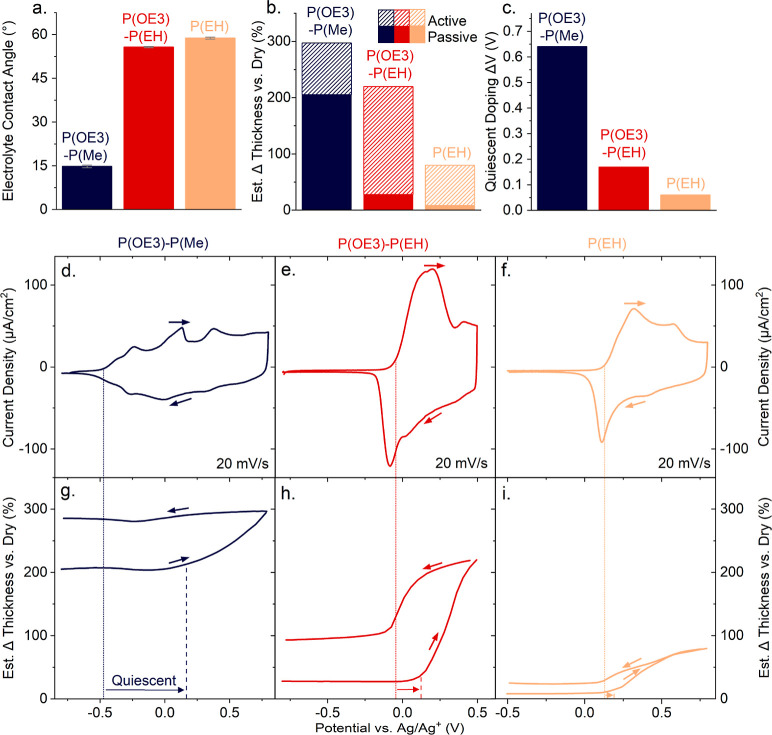
Figure 2.
Swelling and electrochemical behavior of the selected P(ProDOT)s during the first electrochemical cycle. (a) Contact angles (n ≥ 4) of 0.5 M TBA+PF6–/PC droplets on thin films of the three selected P(ProDOT)s, revealing that P(OE3)-P(EH) and P(EH) are relatively apolar, while P(OE3)-P(Me) is polar. (b) Thickness change of swollen P(ProDOT) films relative to their dry state recorded during passive (solid bars) and active swelling (dashed bars). The latter values were estimated via the third overtone frequency shift at films’ maximum doping potentials, i.e., at 0.8 V for P(OE3)-P(Me) and P(EH) and at 0.5 V for P(OE3)-P(EH). (c) Extent of quiescent doping, i.e., the potential interval where oxidation is observed in the cyclic voltammogram without any associated thickness change, deduced from the electrochemical quartz-crystal microbalance with dissipation (EQCM-D) data shown in panels (d–i). (d–f) Cyclic voltammograms (first redox cycle) were recorded for P(OE3)-P(Me), P(OE3)-P(EH), and P(EH) at a scan rate of 20 mV/s. A detailed discussion on the different electrochemical behaviors of the three polymers is found in the Supporting Information (Figures S7–S8). (g–i) Estimated thickness changes measured during electrochemical cycling (first cycle) as estimated via the third overtone frequency shifts. Dotted lines in panels (d–i) indicate the onset potentials of oxidation, and the dashed lines in panels (g–i) indicate the onset of active-swelling; arrows in panels (g–i) highlight the quiescent doping interval (data used in panel c). Taking the first derivative of the thickness (see Figure S11 in the Supporting Information) assists identifying these critical potentials; it also helps visualizing the swelling/deswelling behavior of the three polymers.

