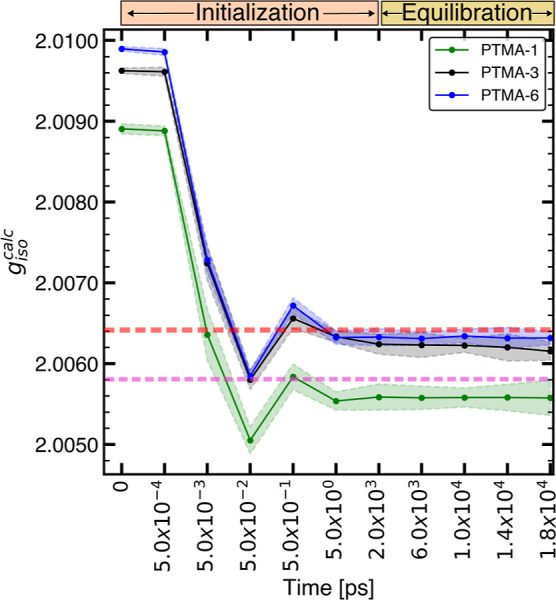
Figure 2.

Evolution of gcalciso along the MD-1 trajectory. Each data point is the average of gcalciso for 10 individual structures. Shaded regions denote the standard deviation. Before the equilibration run starting at 2000 ps, an initialization step was done. Experimental giso for PTMA (red) and its monomer (magenta) in the solution state equal to 2.0064 and 2.0058, respectively, and are denoted by dashed lines.
