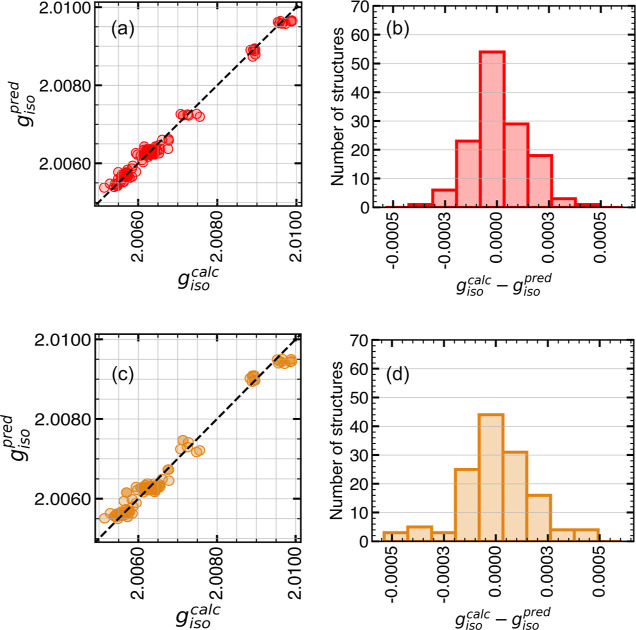
Figure 3.
Performance evaluation of the model trained on MBTR and DAD structures using the TE-1 data set. Correlation plot showing gcalciso vs gprediso for TE-1 structures represented using (a) MBTR and (c) DAD descriptors. Histograms showing gcalciso – gprediso for TE-1 structures represented using (b) MBTR and (d) DAD descriptors.

