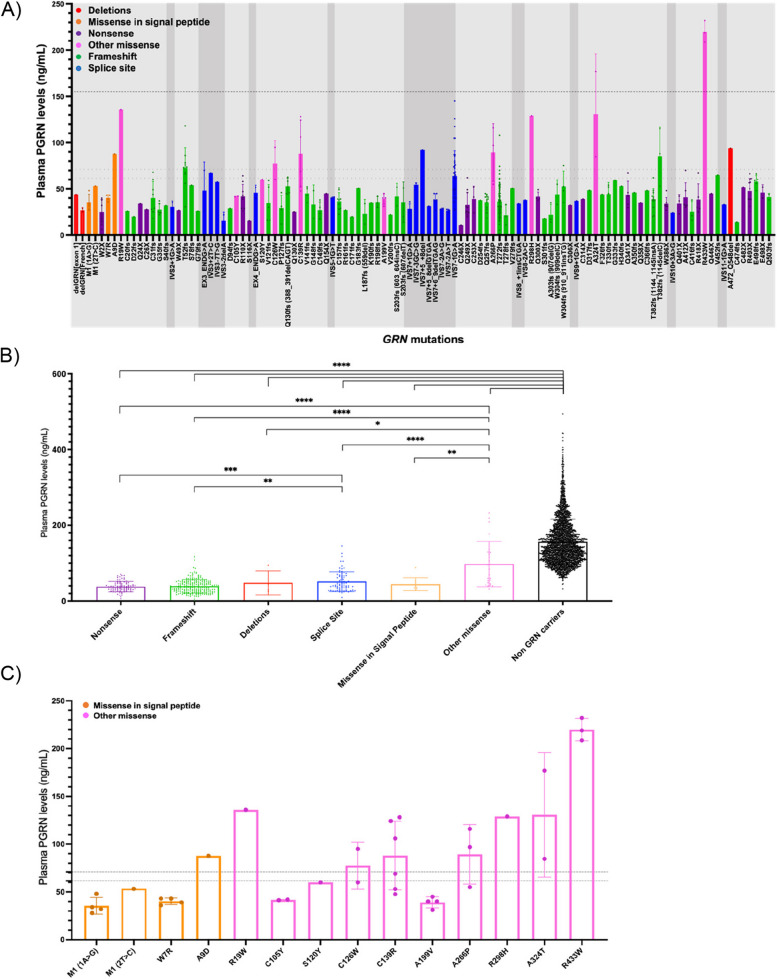
Fig. 1.
A Plasma PGRN concentrations across individual GRN variants. Light grey shading denotes exonic regions and darker grey shading intronic regions. Dotted lines denote previously published with cut-offs for pathogenicity 61.55 [14] and 71.00 [30] and average non-GRN plasma PGRN concentration (156.02 ng/mL). Different colours represent different types of variants. B Plasma PGRN concentrations by mutation type. * P < 0.05, ** P < 0.01, *** P < 0.001, **** P < 0.0001, two-tailed Mann–Whitney Test. Small sample sizes in deletions (n = 4) and missense in signal peptide (n = 10). C Plasma PGRN concentrations in different GRN missense variants. Dotted lines denote cut-offs previously published of 61.55 [14] and 71.00 [30]. Error bars indicate standard error of the mean (SEM)

