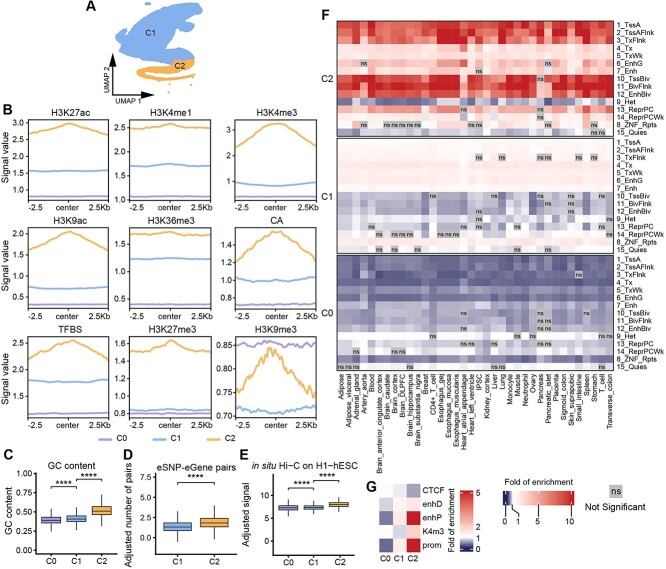
Figure 2.
Characterizing two distinct classes of eQTL-hotspots. (A) UMAP projection of the genomic features based on k-mers (k = 6) showing the two classes of eQTL-hotspots. (B) The consensus landscape of relevant epigenomic features of hotspot-C1, hotspot-C2 and non-hotspot (C0). The x-axis represents the genomic region of 2.5 kb on either side of the center of the segments of specific class, and the y-axis represents the signal values for an epigenomic mark. (C–E) The distributions of the GC content (C), log-transformed number of eSNP–eGene pairs per kilobase (D) and log-transformed signal of in situ HiC on H1-hESC per kilobase (E) in hotspot-C1, hotspot-C2 and non-hotspot (C0). P-values were calculated using the one-sided Wilcoxon rank-sum test. *, P < 0.05; **, P < 0.01; ***, P < 0.001; ****, P < 0.0001; ns, not significant. (F, G) Heatmaps demonstrate the fold of enrichment/depletion for chromatin states (F) and cCREs (G) across hotspot-C1, hotspot-C2 and non-hotspot C0.

