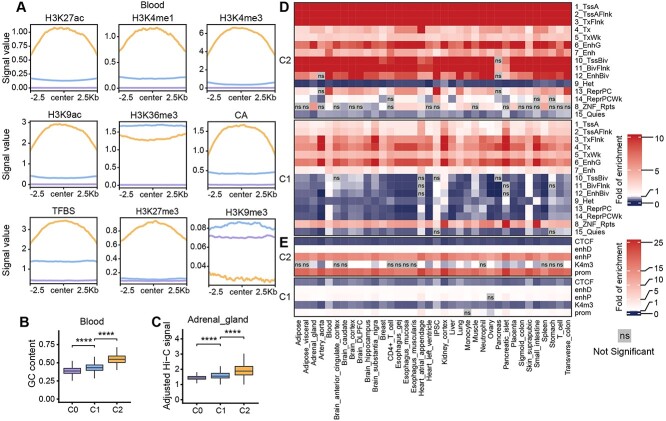
Figure 4.
Characterizing predicted tissue- or cell-type-specific eQTL-hotspots. (A) The consensus landscape of relevant epigenomic features of predicted eQTL-hotspot-C1, hotspot-C2 and non-hotspot (C0) in blood. The x-axis represents the genomic region of 2.5 kb on either side of the center of the segments of the specific class, and the y-axis represents the signal values for an epigenomic mark. (B) The distributions of GC content in predicted eQTL-hotspots in blood and (C) the distributions of Hi-C signal in adrenal gland in hotspot-C1, hotspot-C2 and non-hotspot (C0). P-values were calculated using the one-sided Wilcoxon rank-sum test. *, P < 0.05; **, P < 0.01; ***, P < 0.001; ****, P < 0.0001; ns, not significant. (D, E) Heatmaps demonstrate the fold of enrichment/depletion for chromatin states (D) and cCREs (E) in hotspot-C1 and C2 across 36 tissues or cell types.

