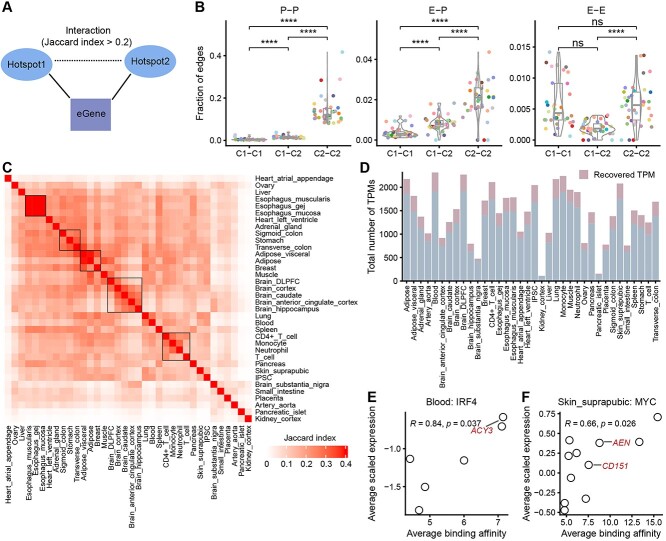
Figure 6.
Reconstruction of the cis-regulatory networks using inferred eQTL-hotpots. (A) Two eQTL-hotspots are considered to be interacted if the corresponding eGene sets show a JI > 0.2. (B) The fractions of three types of interactions (P-P, E-P and E-E) are presented at the edges corresponding to C1-C1, C1-C2 and C2-C2 across 36 tissues or cell types. Each colored dot represents one tissue or cell type. See Figure 5 for the legend of tissue colors. P-values were calculated using the one-sided Wilcoxon rank-sum test, and were adjusted using ‘bonferroni’. ∙, adjusted P < 0.1; *, adjusted P < 0.05; **, adjusted P < 0.01; ***, adjusted P < 0.001; ****, adjusted P < 0.0001; ns, not significant. (C) Heatmaps demonstrate the similarity of cis-regulatory networks among 36 tissues or cell types. Tissues are ordered by agglomerative hierarchical clustering. (D) The distribution of the total number of TPMs in different tissues or cells. (E, F) The significant positive correlation between transcription factor binding activities within TPM hotspots and the scaled expression of the corresponding eGenes as demonstrated by IRF4 in blood (E) and MYC in suprapubic skin (F). Each dot represents one TPM. The x-axis represents the average binding activity of the transcription factor in TPM, while the y-axis represents the average of Z-score scaled eGene expression in TPM. The eGenes of known targets of IRF4 and MYC are labeled.

