
Figure 8.
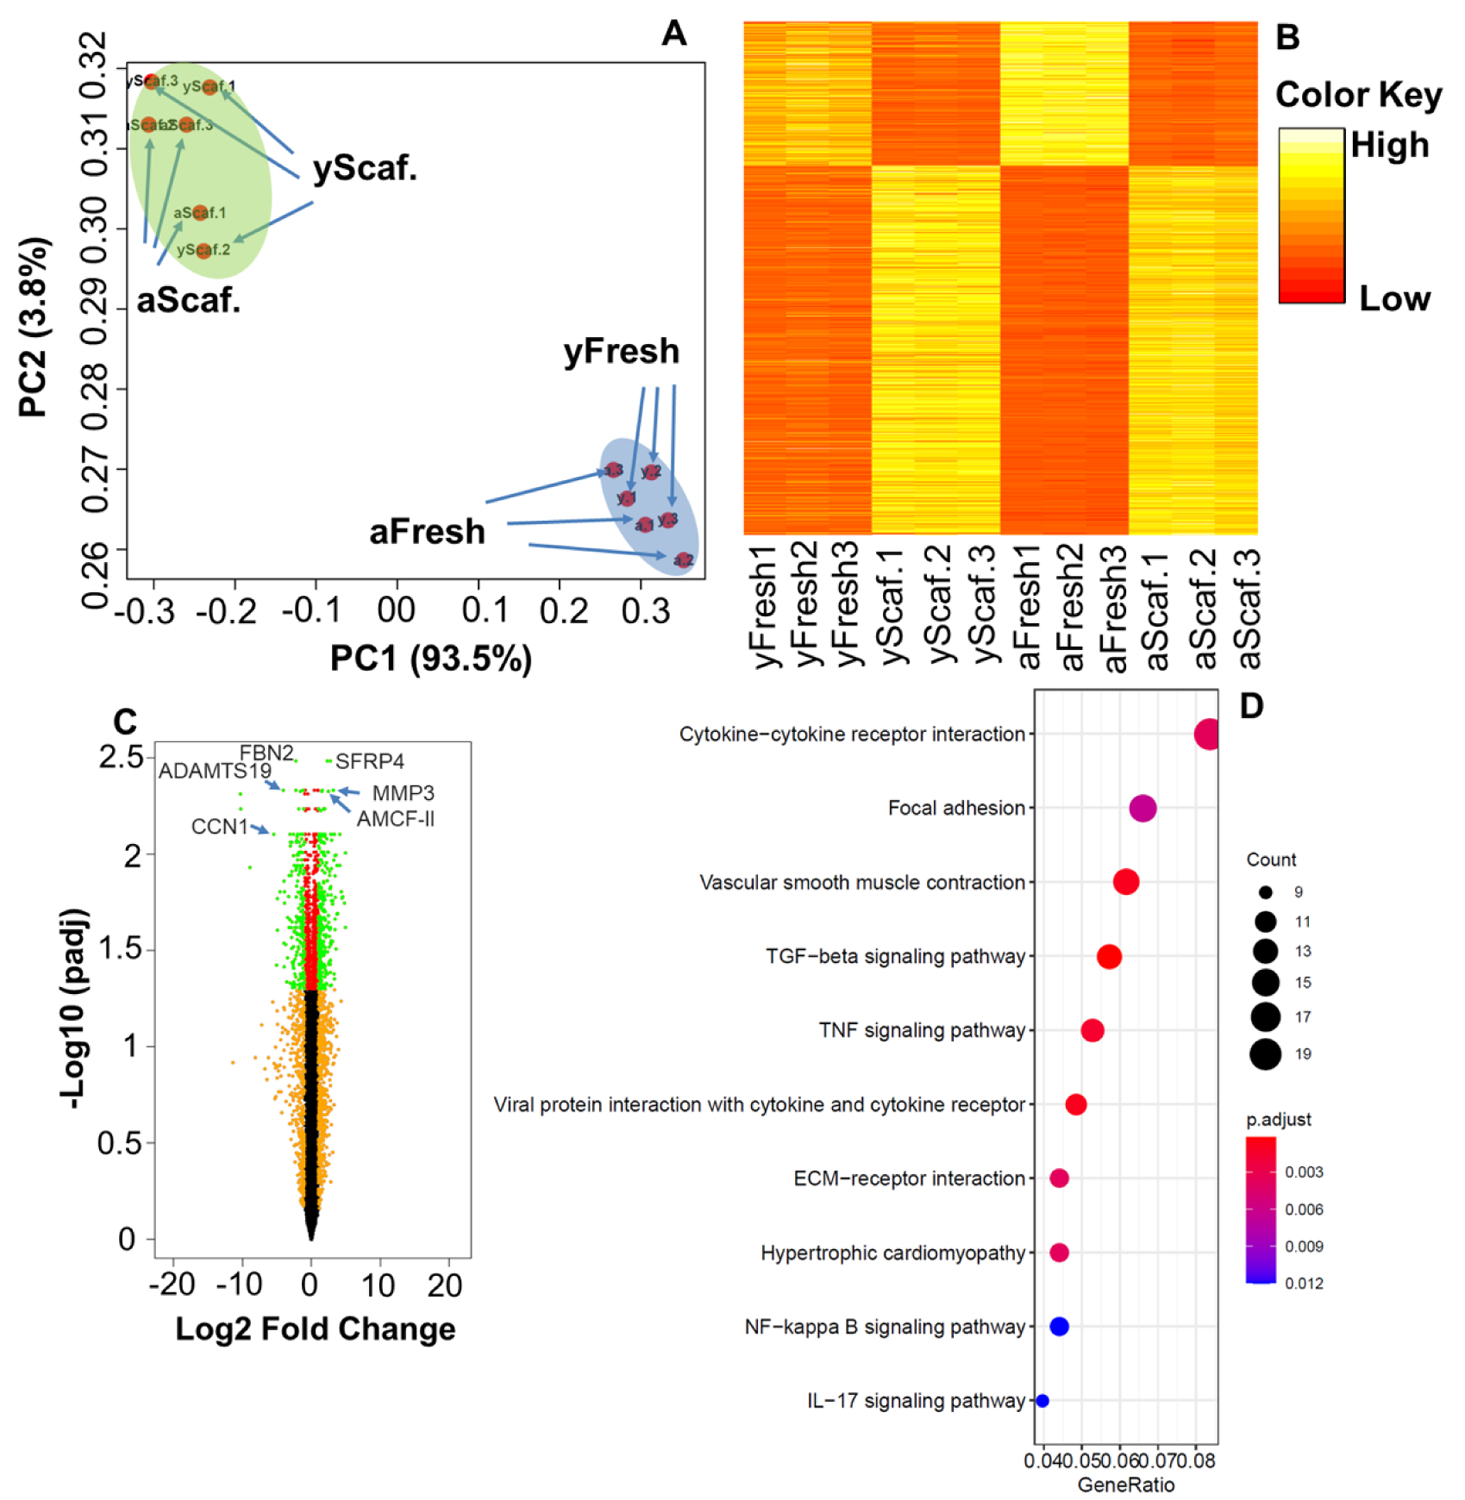
(A) Principal component scatter plot showing the overall similarity of gene expression among four groups; PC1 accounted for 93.5% of the variance, and PC2 accounted for 3.8% of the variance. (B) Heatmap of all the differentially expressed genes among the four groups. (C) Volcano plot (aScaffold vs. yScaffold); Genes with adjusted p ≤ 0.05 and log2 FC ≥2 or ≤−2 were identified as significantly differently expressed. (D) KEGG pathway enrichment analysis of upregulated genes (aScaffold vs. yScaffold). n=3 for each group.