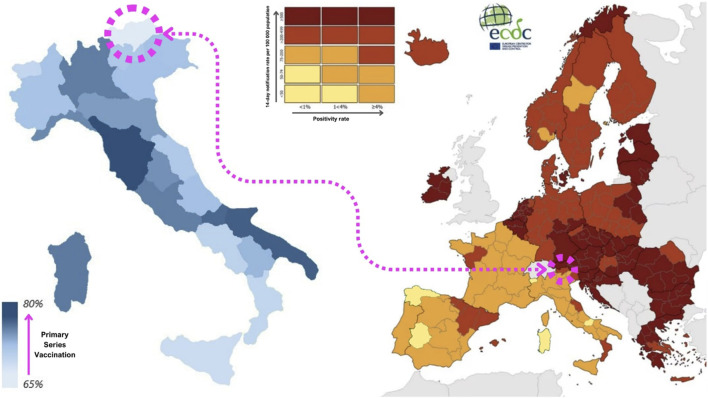
FIGURE 1.
On the left side, map of completed primary series coverage between Italian regions on the second week of February 2022. (Italy, 2022) [2] On the right side, SARS-CoV-2 incidence rates between European territories on the first week of November (image taken and adapted from the European Centre for Disease Prevention and Control) [3]. (Europe, 2021).

