Figure 1.
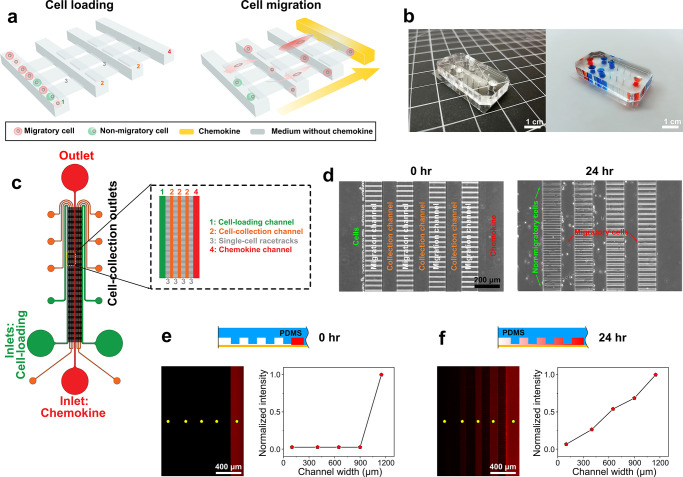
Overview of the CTC-Race assay and its device. (a) Schematic of CTC-Race assay. The microfluidic device comprises a cell-loading channel (1), multiple single-cell racetrack segments (3), multiple cell-collection channels (2), and a chemokine channel (4). The height of single-cell racetracks is designed to be smaller than the diameter of cancer cells so that cancer cells are trapped at the entrance of single-cell racetracks at the start of the assay. Migratory cells (red) squeeze into the tracks and migrate toward the region with a high concentration of chemoattractants, while the nonmigratory cells (green) are trapped in the cell-loading channel during the assay. Cell-collection channels are inserted into the single-cell racetracks perpendicularly to enable cell retrieval. (b) Photos of a PDMS-based CTC-Race device (right, blue and orange colors indicate the channel geometry). (c) Top view schematic of the CTC-Race device. Cells are injected via the cell-loading inlets, and chemokines are continuously perfused through the chemokine channel. The device has a symmetric design with each side having a cell-loading channel (width of 200 μm, height of 50 μm), three cell-collection channels (width of 100 μm, height of 50 μm), and four segments of single-cell racetracks (each segment’s length, 150 μm, width of 30 μm, height of 5 μm). There are 2500 single-cell racetracks on each side and 5000 racetracks in total in one device. Both sides share a chemokine channel (width of 200 μm, height of 50 μm). (d) Phase-contrast images of the migration pattern of MDA-MB-231 breast cancer cells in the CTC-Race device. Chemokine channel is loaded with serum (fetal bovine serum, FBS) as a chemoattractant. (e) Top, side view of rhodamine B (red) concentration at t = 0 h. Bottom left, a fluorescent image of the device at t = 0 h of rhodamine B perfusion with a flow rate of 0.1 μL/min. Bottom right, normalized fluorescence intensity across the device at the selected positions in the device (yellow dots on the fluorescent image) at t = 0 h. (f) Top, side view of rhodamine B (red) at t = 24 h. Bottom left, a fluorescent image of the device at t = 24 h. Bottom right, normalized fluorescence intensity across the device at t = 24 h.

