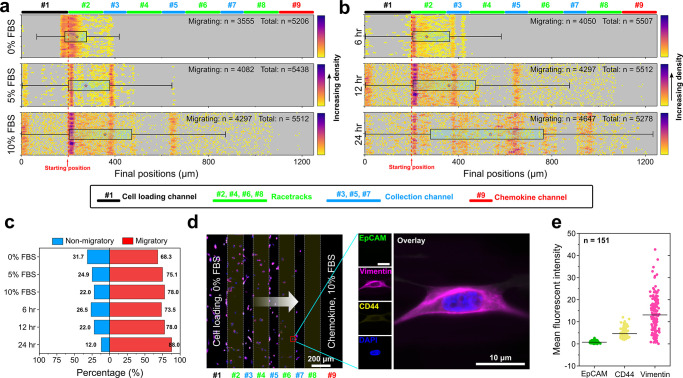
Figure 2.
Validation of the CTC-Race assay using a clonal population of MDA-MB-231 breast cancer cells. ∼5000 cancer cells suspended in FBS-free medium were loaded into the cell-loading channel. Chemokine channel was perfused with 10% FBS at a flow rate of 0.1 μL/min. (a) Dependence of cells’ final positions on the FBS concentration. The final positions of cells at different FBS concentrations (0%, 5%, and 10%) are represented as dots, with the colors of the dots signifying their relative percentage within the cell population. The time duration of the assay was 12 h. Total numbers of seeded cells and migrating cells are shown in each subplot. Migrating cells are defined as the cells that squeeze into the racetracks and migrate toward FBS. Box plots include the smallest, lower quartile, mean, upper quartile, and largest final positions for cells. Cells’ final positions are 247.23 ± 97.98 μm (n = 5206) for 0% FBS, 282.04 ± 145.32 μm (n = 5438) for 5% FBS, and 363.94 ± 260.97 μm (n = 5512) for 10% FBS. All values are mean ± sd. (b) Dependence of cells’ final positions on the assay duration. Final positions of MDA-MB-231 cells in the device at different assay duration (6, 12, and 24 h) are shown. FBS concentration in the chemokine channel was 10%. Cells’ final positions are 263.23 ± 127.99 μm (n = 5507) for 6-h assay, 363.94 ± 260.97 μm (n = 5512) for 12-h assay, and 556.89 ± 303.54 μm (n = 5278) for 24-h assay. All values are mean ± sd. (c) Percentages of nonmigratory and migratory cells under different FBS concentrations (time = 12 h) and different assay duration (FBS concentration = 10%). (d) Left panel: an image of immunofluorescently labeled MDA-MB-231 cells in the CTC-Race device after a 24-h assay. The white arrow indicates the cells’ migration direction toward the FBS. Cells are stained with EpCAM, vimentin, CD44, and DAPI. Right panel: a migratory MDA-MB-231 cell in a single-cell racetrack expressing a high level of vimentin, medium level of CD44, and low level of EpCAM. (e) Mean EpCAM, CD44, and vimentin intensities of single migratory MDA-MB-231 cells (n = 151). Mean intensities of EpCAM, CD44, and vimentin are 0.76 ± 0.45, 4.60 ± 2.09, and 13.10 ± 8.10, respectively. All values are mean ± sd.

