Figure 1.
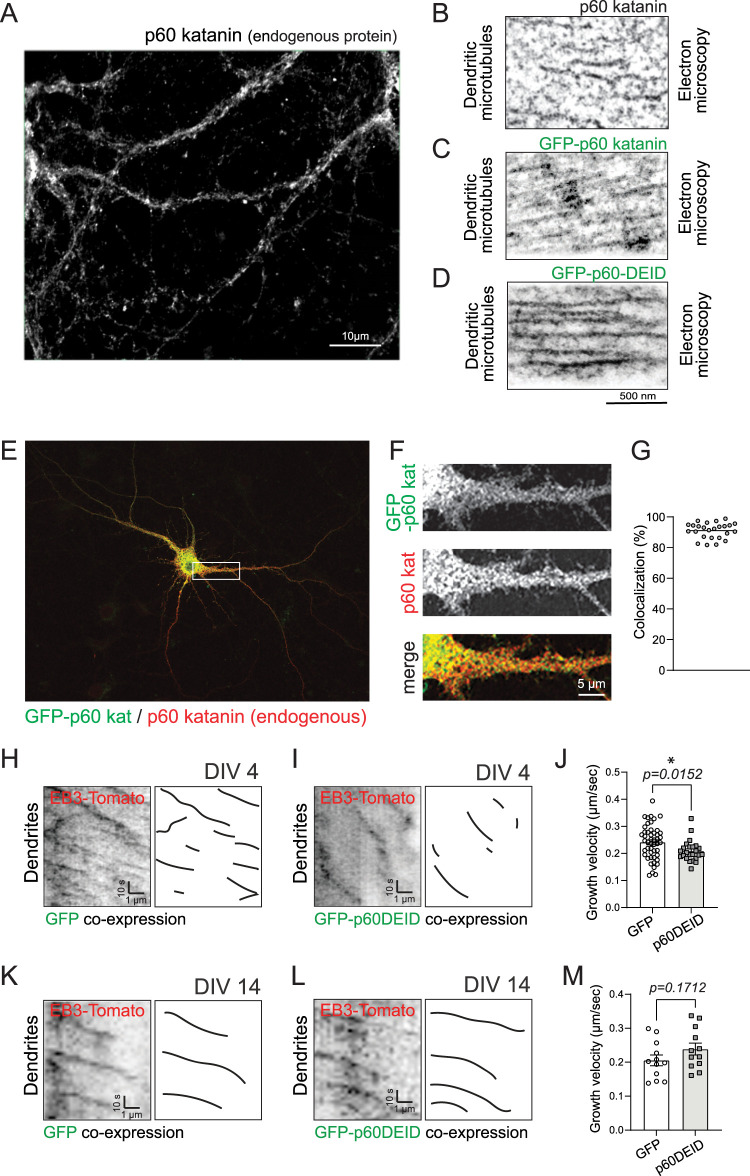
Katanin inhibition affects MT growth in dendrites of premature but not mature neurons. A, Immunostaining of endogenous p60 katanin in dendrites of cultured hippocampal neurons at DIV 13–17. n = 3 experiments. B, Anti-p60 katanin immunoelectron microscopy with diaminobenzidine (DAB) showing MTs from hippocampal neurons. C,D, Anti-GFP immunoelectron microscopy with diaminobenzidine (DAB) showing MTs from hippocampal neurons transfected with either GFP-p60 katanin (C) or GFP-p60DEID (D). E, Overview image of GFP-p60 katanin (green) and endogenous p60 katanin (red). F, Magnifications of boxed region in E. G, Quantification of GFP-p60 katanin/p60 (endogenous) katanin colocalization levels. Mean ± S.E.M. = 91.16 ± 1.006%. Three independent experiments. H,I, EB3-Tomato time-lapse imaging in dendrites of DIV4 hippocampal neurons. Right: diagrams of EB3 tracks for GFP in H and for GFP-p60DEID in I. Neurons express EB3-Tomato (red) with either GFP or GFP-p60DEID (green). The green channel is not shown. J, Quantification of EB3 growth velocity (µm/s). GFP: 0.24 ± 0.01, GFP-p60DEID: 0.21 ± 0.01. Mann–Whitney U test p = 0.0152. GFP: n = 48 comets; GFP-p60DEID: n = 24 comets, three independent experiments. K,L, EB3-Tomato time-lapse imaging in dendrites of DIV14 hippocampal neurons. Right: diagrams of EB3 tracks for GFP in K and for GFP-p60DEID in L. Neurons express EB3-Tomato (red) with either GFP or GFP-p60DEID (green). The green channel is not shown. M, Quantification of K and L shows comparable growth velocity among conditions. GFP: 0.2054 + 0.01584 μm/s, GFP-p60DEID: 0.2387 + 0.01736 μm/s, Unpaired t test, two-tailed, p = 0.1712, (GFP: n = 12 ROIs, 503 comets); (GFP-p60DEID: n = 12 ROIs, 340 comets), four independent experiments.

