Figure 2.
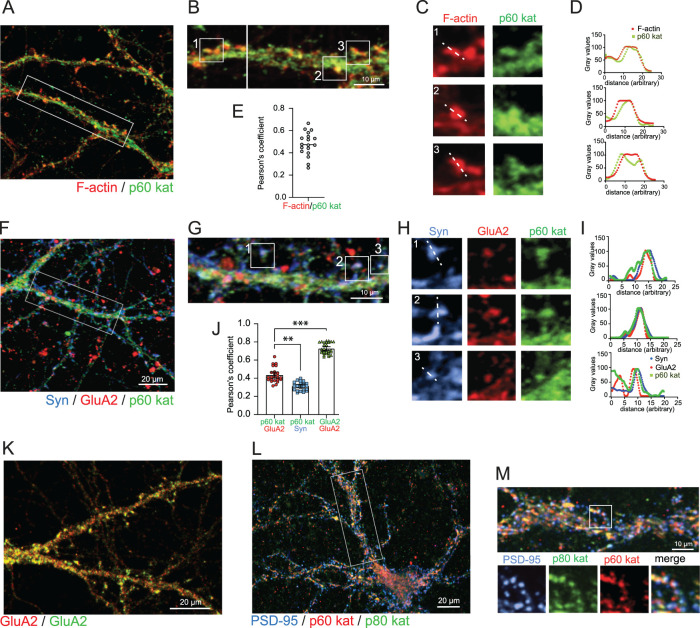
p60 katanin is located at glutamatergic spine synapses. A,B, Immunostaining of endogenous p60 katanin (green), Rhodamine phalloidin labeling of F-actin (red), DIV13–17 neurons, three independent experiments. C, Magnifications of spines from boxed regions in B. D, Fluorescence intensity profiles of line scans in C. E, Pearson's correlation coefficient indicating colocalization between p60 katanin and F-actin. Mean ± S.E.M = 0.4797 ± 0.02536, n = 18 images. F,G, Triple-immunostaining, endogenous p60 katanin (green), AMPAR subunit GluA2 (red), presynaptic marker synaptophysin (Syn, blue), DIV16–17 neurons, three independent experiments. H, Magnification of boxed regions in G. I, Fluorescence intensity profiles of line scans in H. J, Pearson's correlation coefficient between p60 and GluA2, p60 and Syn, or GluA2 (red) and GluA2 (green). p60/GluA2: mean ± S.E.M = 0.4362 ± 0.01646, n = 24 ROIs; p60/Syn: mean ± S.E.M = 0.3144 ± 0.009337, n = 24 ROIs; GluA2/GluA2: mean ± S.E.M = 0.8273 ± 0.01246, n = 30 ROIs. Kruskal–Wallis test: p60/GluA2 versus p60/Syn p = 0.0025; Kruskal–Wallis test: p60/GluA2 versus GluA2/GluA2 p < 0.0001, three independent experiments. K, Immunostaining of AMPA receptor GluA2 subunits with two fluorophores (red and green) as a positive control for the Pearson's correlation coefficient shown in Figure 2J. L,M, Triple immunostaining of p60 katanin (red), p80 katanin (green) and PSD-95 (blue). The boxed region magnified below depicts triple colocalized puncta.

