Figure 4.
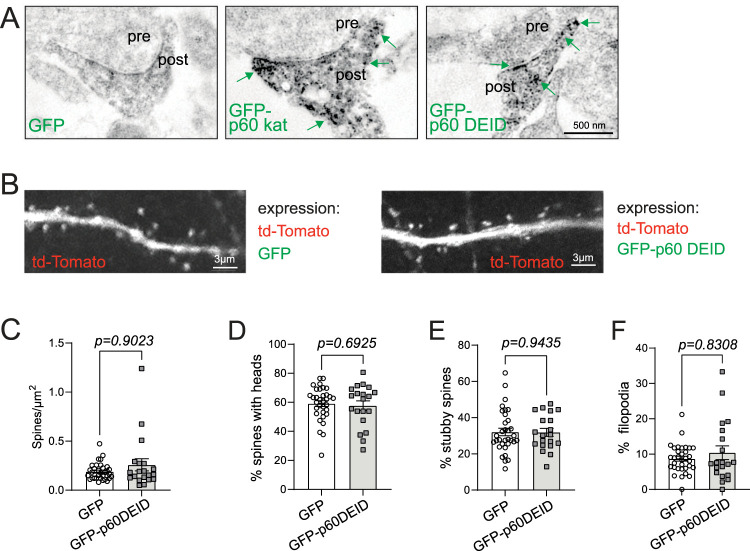
Analysis of GFP-p60DEID expression regarding spine density and structure. A, DAB immunoelectron microscopy of dendritic spines of hippocampal cultures transfected either with GFP, GFP-p60 katanin, or GFP-p60DEID katanin. B, Hippocampal neurons at DIV 12–17 transfected with td-Tomato as volume marker to visualize dendritic spines and either GFP or GFP-p60DEID. Please note that the red channel (td-Tomato) is shown, whereas the green channel is not shown. C, Quantification of spine density (number of spines/µm2). GFP: 0.19 ± 0.01%, GFP-p60DEID: 0.26 ± 0.06%. Mann–Whitney U test p < 0.9023 (GFP: n = 33 cells, GFP-p60DEID n = 20 cells), three independent experiments. D, Quantification of % spines with heads. GFP: 59.16 ± 2.01%, GFP-p60DEID: 57.72 ± 3.23%, unpaired two-tailed t test p = 0.6925 (GFP: n = 33 cells, GFP-p60DEID: n = 20 cells), three independent experiments. E, Quantification of percentage stubby spines. GFP: 32.10 ± 2.08%, GFP-p60DEID: 31.88 ± 2.19%, unpaired two-tailed t test p = 0.9435 (GFP: n = 33 cells, GFP-p60DEID: n = 20 cells), three independent experiments. F, Quantification of percentage filopodia. GFP: 8.70 ± 0.70%, GFP-p60DEID: 10.40 ± 1.95%, Mann–Whitney U test p = 0.8308 (GFP: n = 33 cells, GFP-p60DEID: n = 20 cells), three independent experiments.

