Figure 5.
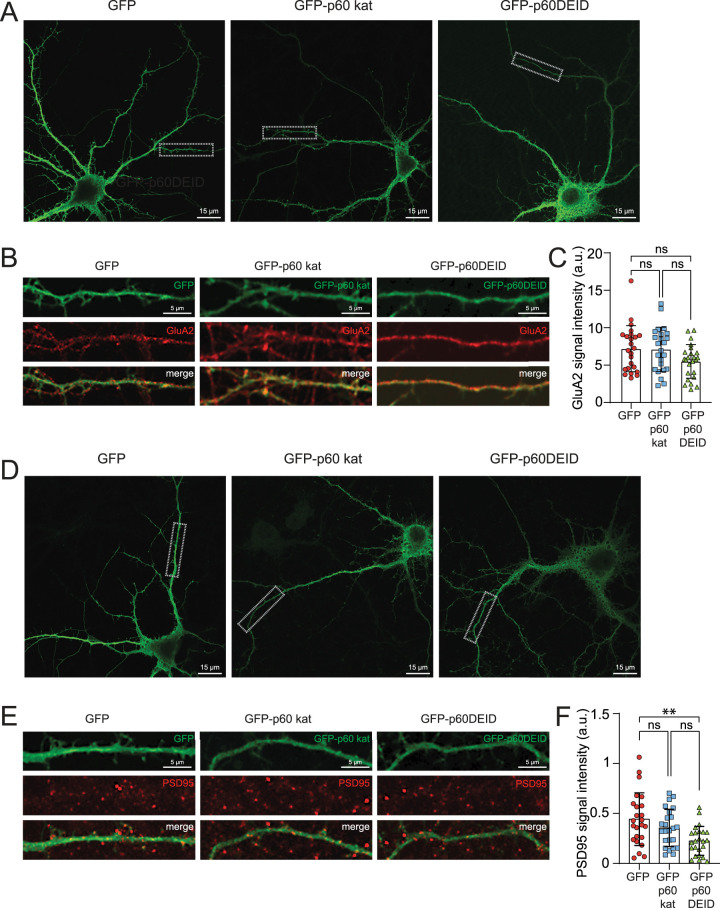
Analysis of GluA2 and PSD-95 signal intensities following overexpression of GFP-p60DEID. A,B, Hippocampal neurons depicting endogenous GluA2 (red), expressing either GFP (left), GFP-p60 katanin (middle) or GFP-p60DEID katanin (right), respectively. Scale bars: 15 µm (upper overview images) and 5 µm (magnifications). C, Quantification of B, the signal intensity of GluA2 in 30 µm sections of secondary dendrites of hippocampal cultures transfected either with GFP, GFP-p60 katanin, or GFP-p60DEID katanin. GFP: mean ± S.E.M = 7.199 ± 0.628, n = 24 ROIs; GFP-p60 katanin: mean ± S.E.M = 7.109 ± 0.604, n = 24 ROIs; GFP-p60DEID: mean ± S.E.M = 5.490 ± 0.461, n = 24 ROIs, three independent experiments. Kruskal–Wallis test followed by Dunn's multiple comparison test: GFP versus GFP-p60 katanin p > 0.9999; GFP versus GFP-p60DEID p = 0.1604; GFP-p60 katanin versus GFP-p60DEID p = 0.1579. D,E, Hippocampal neurons depicting endogenous PSD-95 (red), expressing either GFP (left), GFP-p60 katanin (middle), or GFP-p60DEID katanin (right), respectively. Scale bars: 15 µm (upper overview images) and 5 µm (magnifications). F, Quantification of E, the signal intensity of PSD-95 in 30 µm sections of secondary dendrites of hippocampal cultures transfected either with GFP, GFP-p60 katanin, or GFP-p60DEID katanin. GFP: mean ± S.E.M = 0.443 ± 0.054, n = 24 ROIs; GFP-p60 kat: mean ± S.E.M = 0.355 ± 0.038, n = 24 ROIs; GFP-p60DEID: mean ± S.E.M = 0.227 ± 0.029, n = 24 ROIs, three independent experiments. Ordinary one-way ANOVA test followed by Sidak's multiple comparison test: GFP versus GFP-p60 katanin p = 0.3603; GFP versus GFP-p60DEID p = 0.0014; GFP-p60 katanin versus GFP-p60DEID p = 0.0968.

