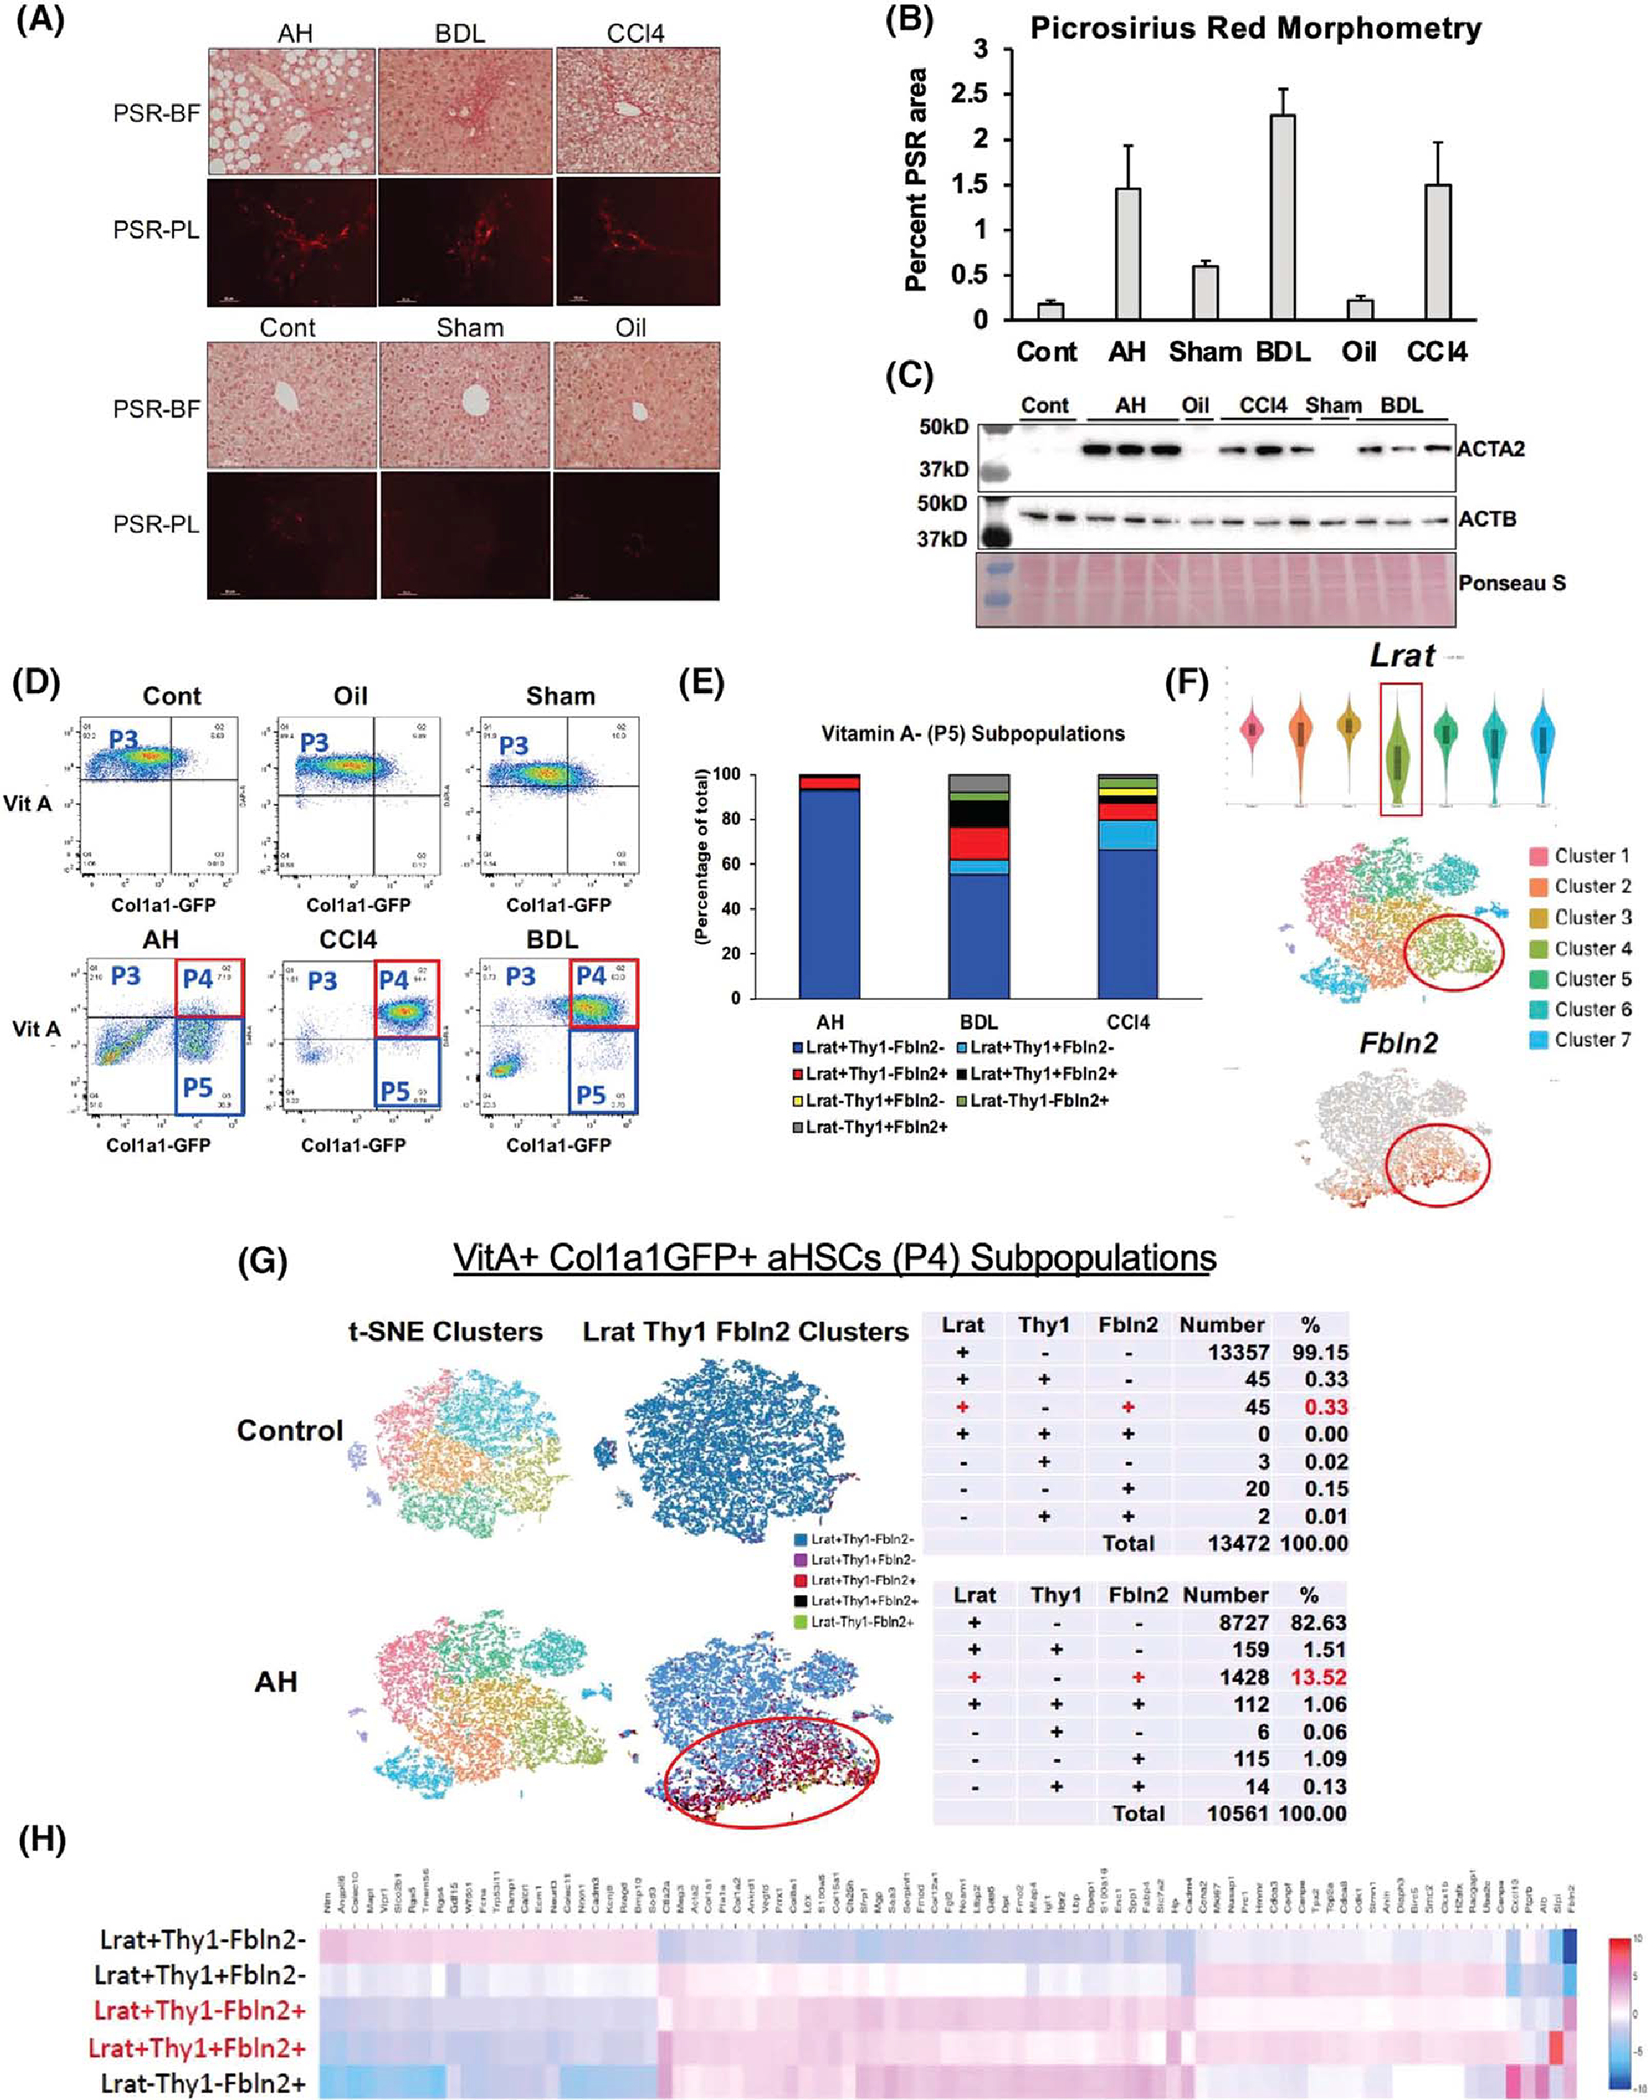
FIGURE 1.

(A) Picrosirius red (PSR) staining of the alcoholic hepatitis (AH), bile duct ligation (BDL), and mouse CCl4 livers (upper panel) and respective control (Cont) livers (lower panel) imaged under bright field (PSR-BF) or polarized light (PSR-PL). Scale: ×20. (B) Morphometric analysis data of PSR-PL images of ten 400-μm2 random foci in perivenular or periportal zone per mouse using the image J software (n = 3 for each mouse group). (C) Immunoblot analysis of α-smooth muscle Actin (ACTA2), the accepted readout of liver fibrosis, with β-actin (ACTB) as a loading control. (D) FACS separation of liver mesenchymal cells gated by vitamin A (VitA) autofluorescence (y-axis) and collagen type 1 alpha 1 (Col1a1)–green fluorescent protein (GFP) (x-axis). (E) Percent distribution of various cell subpopulations in VitA− (P5) mesenchymal cells from AH, BDL, and CCl4 models based on lecithin retinol acyltransferase (Lrat), Thy1 cell surface antigen (Thy1), and fibulin-2 (Fbln2) expression. (F) Lrat expression of single-cell RNA-sequencing (scRNA-seq) clusters of the AH VitA+GFP+ P4 cells shown by violin plot (top), t-distributed stochastic neighbor embedding (t-SNE) plot of the clusters (middle), and distribution of Fbln2-expressing cells (bottom). (G) t-SNE plots of the control and AH mouse P4 activated HSCs (aHSCs; left), supervised clustering based on Lrat, Thy1, and Fbln2 expression (middle), and summary tables for the breakdown of subpopulations based on the expression of the three genes (right). (H) Heatmap of differentially expressed genes (DEGs) comparing the five subpopulations of P4 aHSCs based on Lrat, Thy1, and Fbln2 expression.
