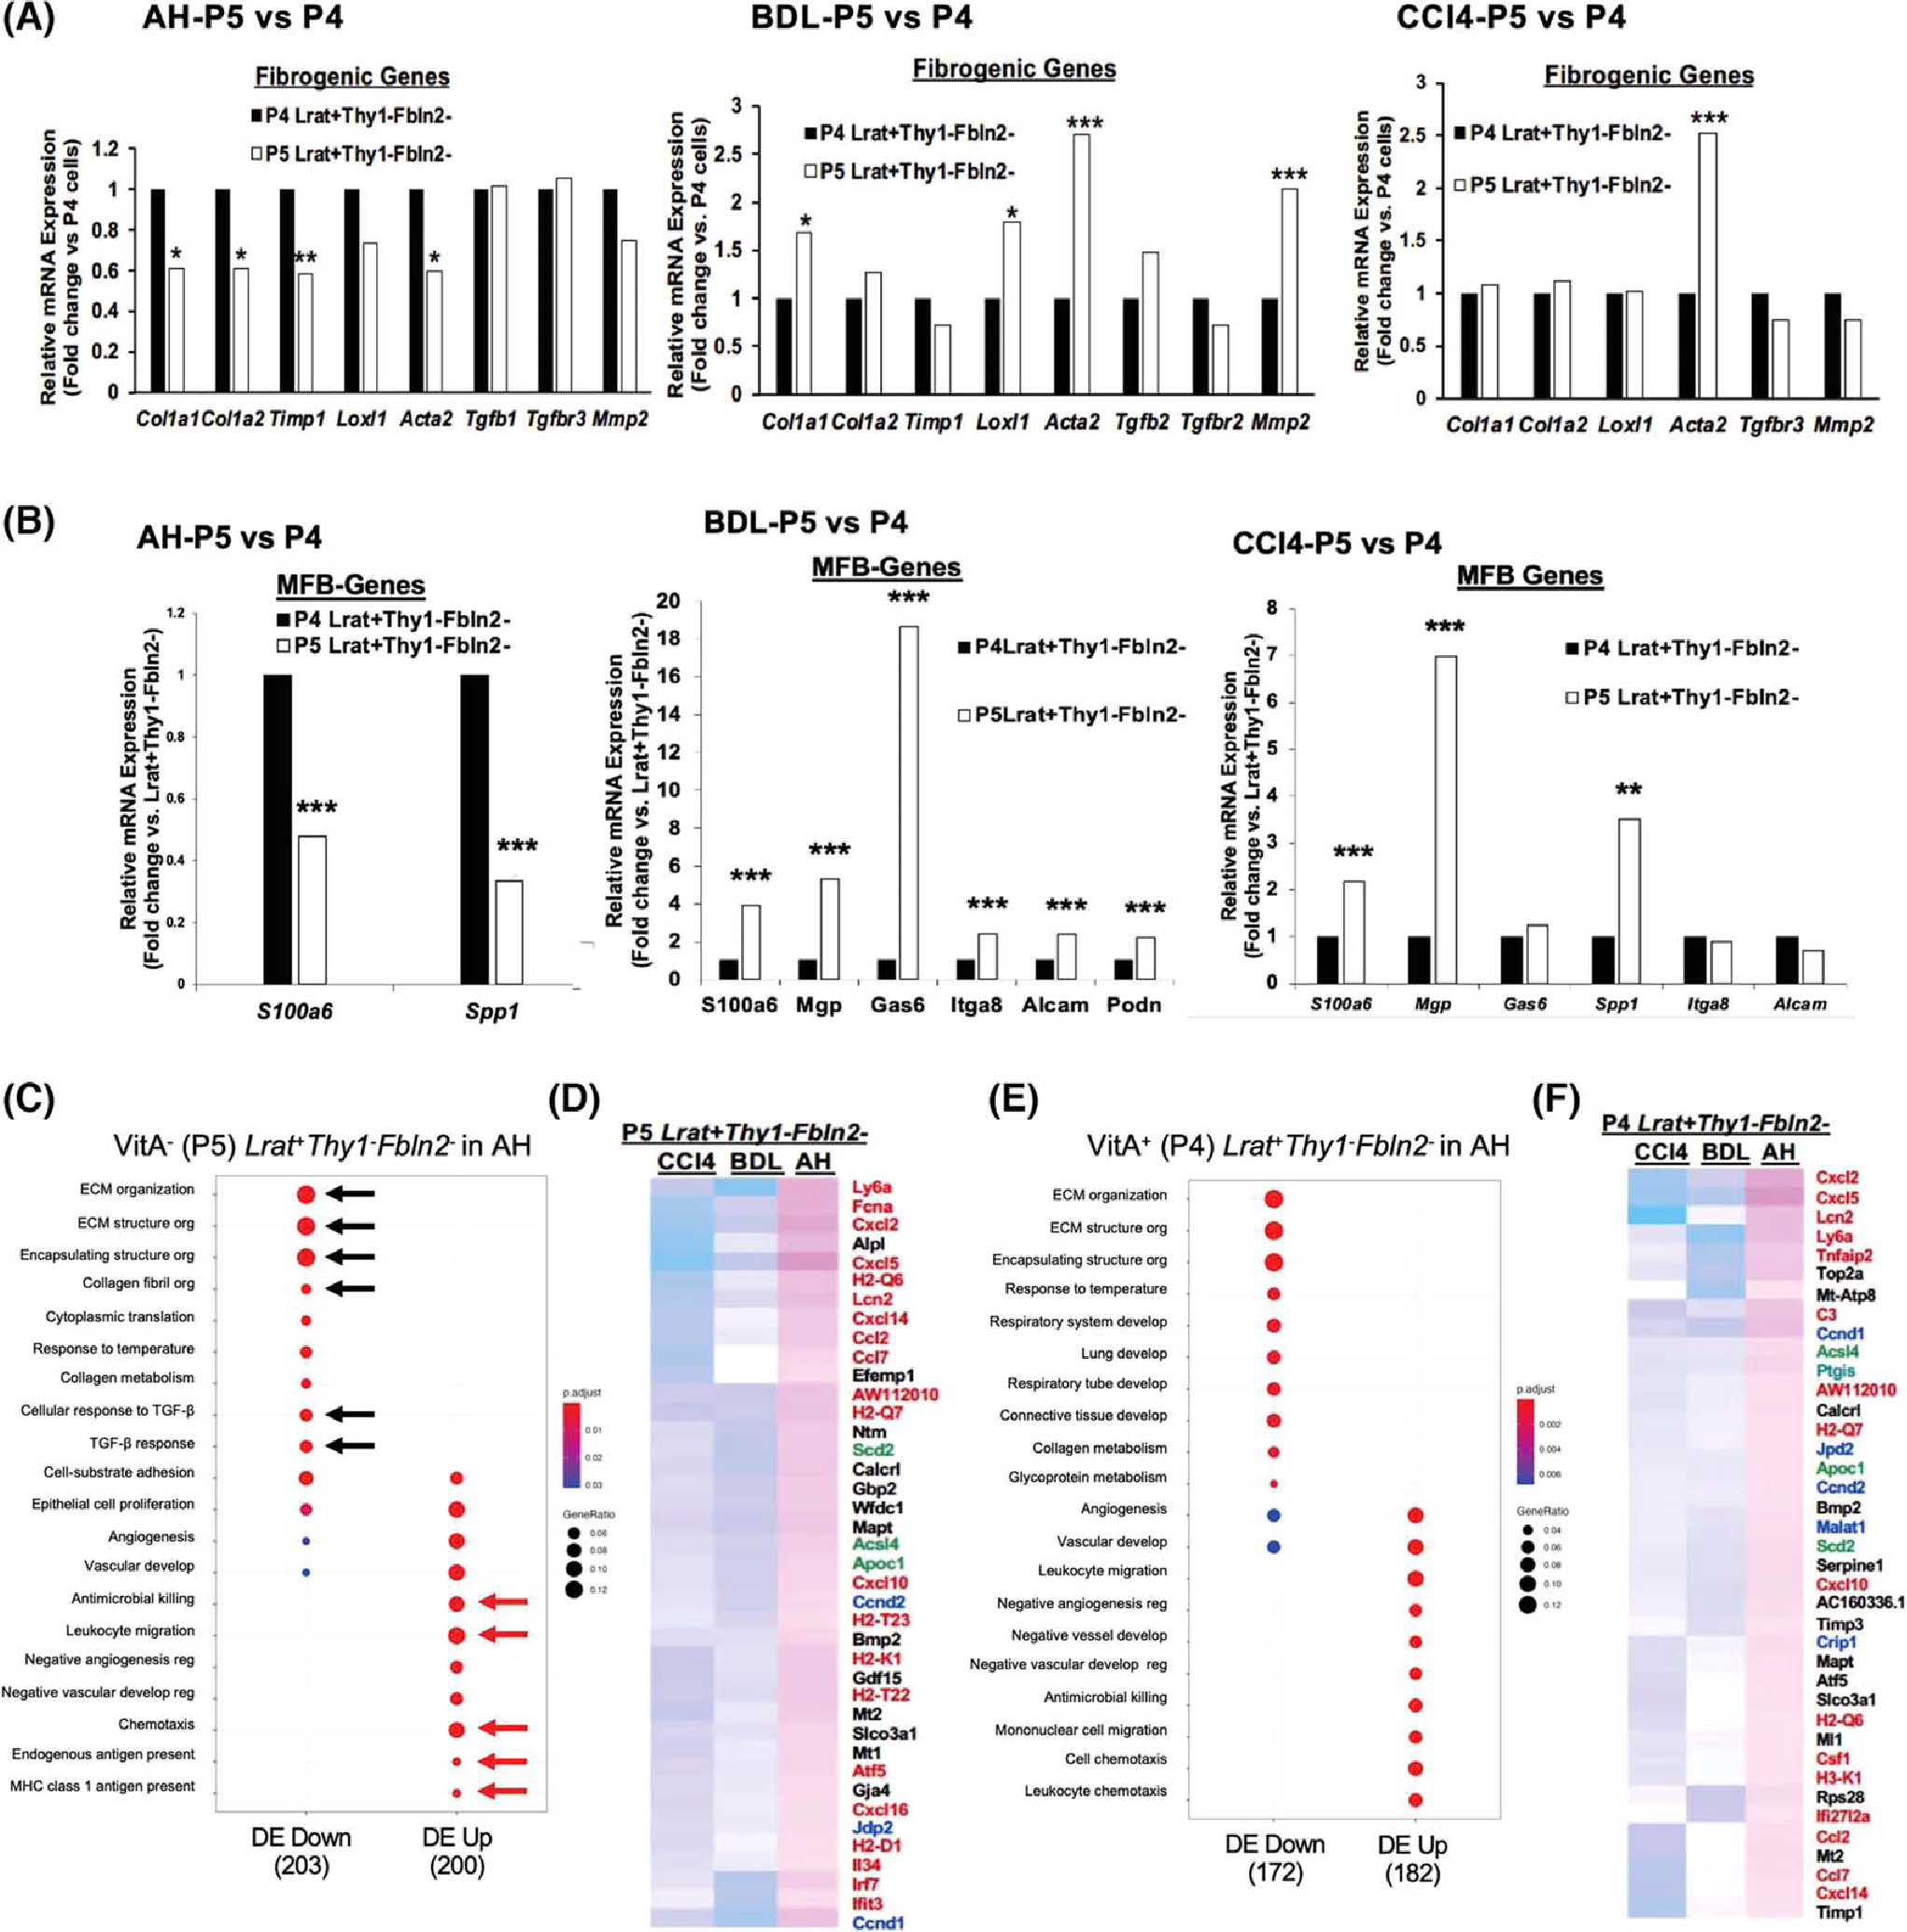
FIGURE 3.

(A) Comparison of profibrotic gene expression between VitA+ (P4) and VitA− (P5). Lrat+Thy1−Fbln2− aHSCs in AH (left), BDL (middle), and CCl4 (right) (*p < 0.05, **p < 0.01, ***p < 0.005 vs. P4 aHSCs). (B) Comparison of MFB gene expression between VitA+ (P4) and VitA− (P5) Lrat+Thy1−Fbln2− aHSCs in AH (left), BDL (middle), and CCl4 (right) (**p < 0.01, ***p < 0.005 vs. P4 aHSCs). (C) Pathway analysis of DEGs in VitA− Lrat+Thy1−Fbln2− aHSCs in AH versus the same subset in BDL and CCl4 by the Go Biological Processes, identifying significantly down-regulated extracellular matrix (ECM) pathways (black arrows) and up-regulated antimicrobial, inflammatory, and antigen presentation pathways (red arrows) in AH versus BDL and CCl4. The gene ratio was calculated by dividing the number of DEGs that are significantly enriched in a given pathway by the total number of DEGs and depicted by the size of each circle. (D) Partial heatmap showing significantly up-regulated DEGs in VitA− (P5) Lrat+Thy1−Fbln2− aHSCs in AH versus BDL and CCl4. Inflammatory and immunoregulatory genes are denoted by red, cell proliferation genes by blue, and lipid metabolic genes by green. (E) The same Go Biological Processes pathway analysis for VitA+ (P4) Lrat+Thy1−Fbln2− aHSCs in AH versus BDL and CCl4 as shown for (C). (F) Partial heatmap showing significantly up-regulated DEGs in VitA+ (P4) Lrat+Thy1−Fbln2− aHSCs in AH versus BDL and CCl4 as shown for (D). Alcam, activated leukocyte cell adhesion molecule; Itga8, integrin subunit alpha 8; Loxl1, lysyl oxidase like 1; MHC, major histocompatibility complex; Mmp2, matrix metalloproteinase 2; Podn, podoplanin; Spp1, osteopontin; Timp1, tissue inhibitor of metalloproteinase 1.
