
FIGURE 4.
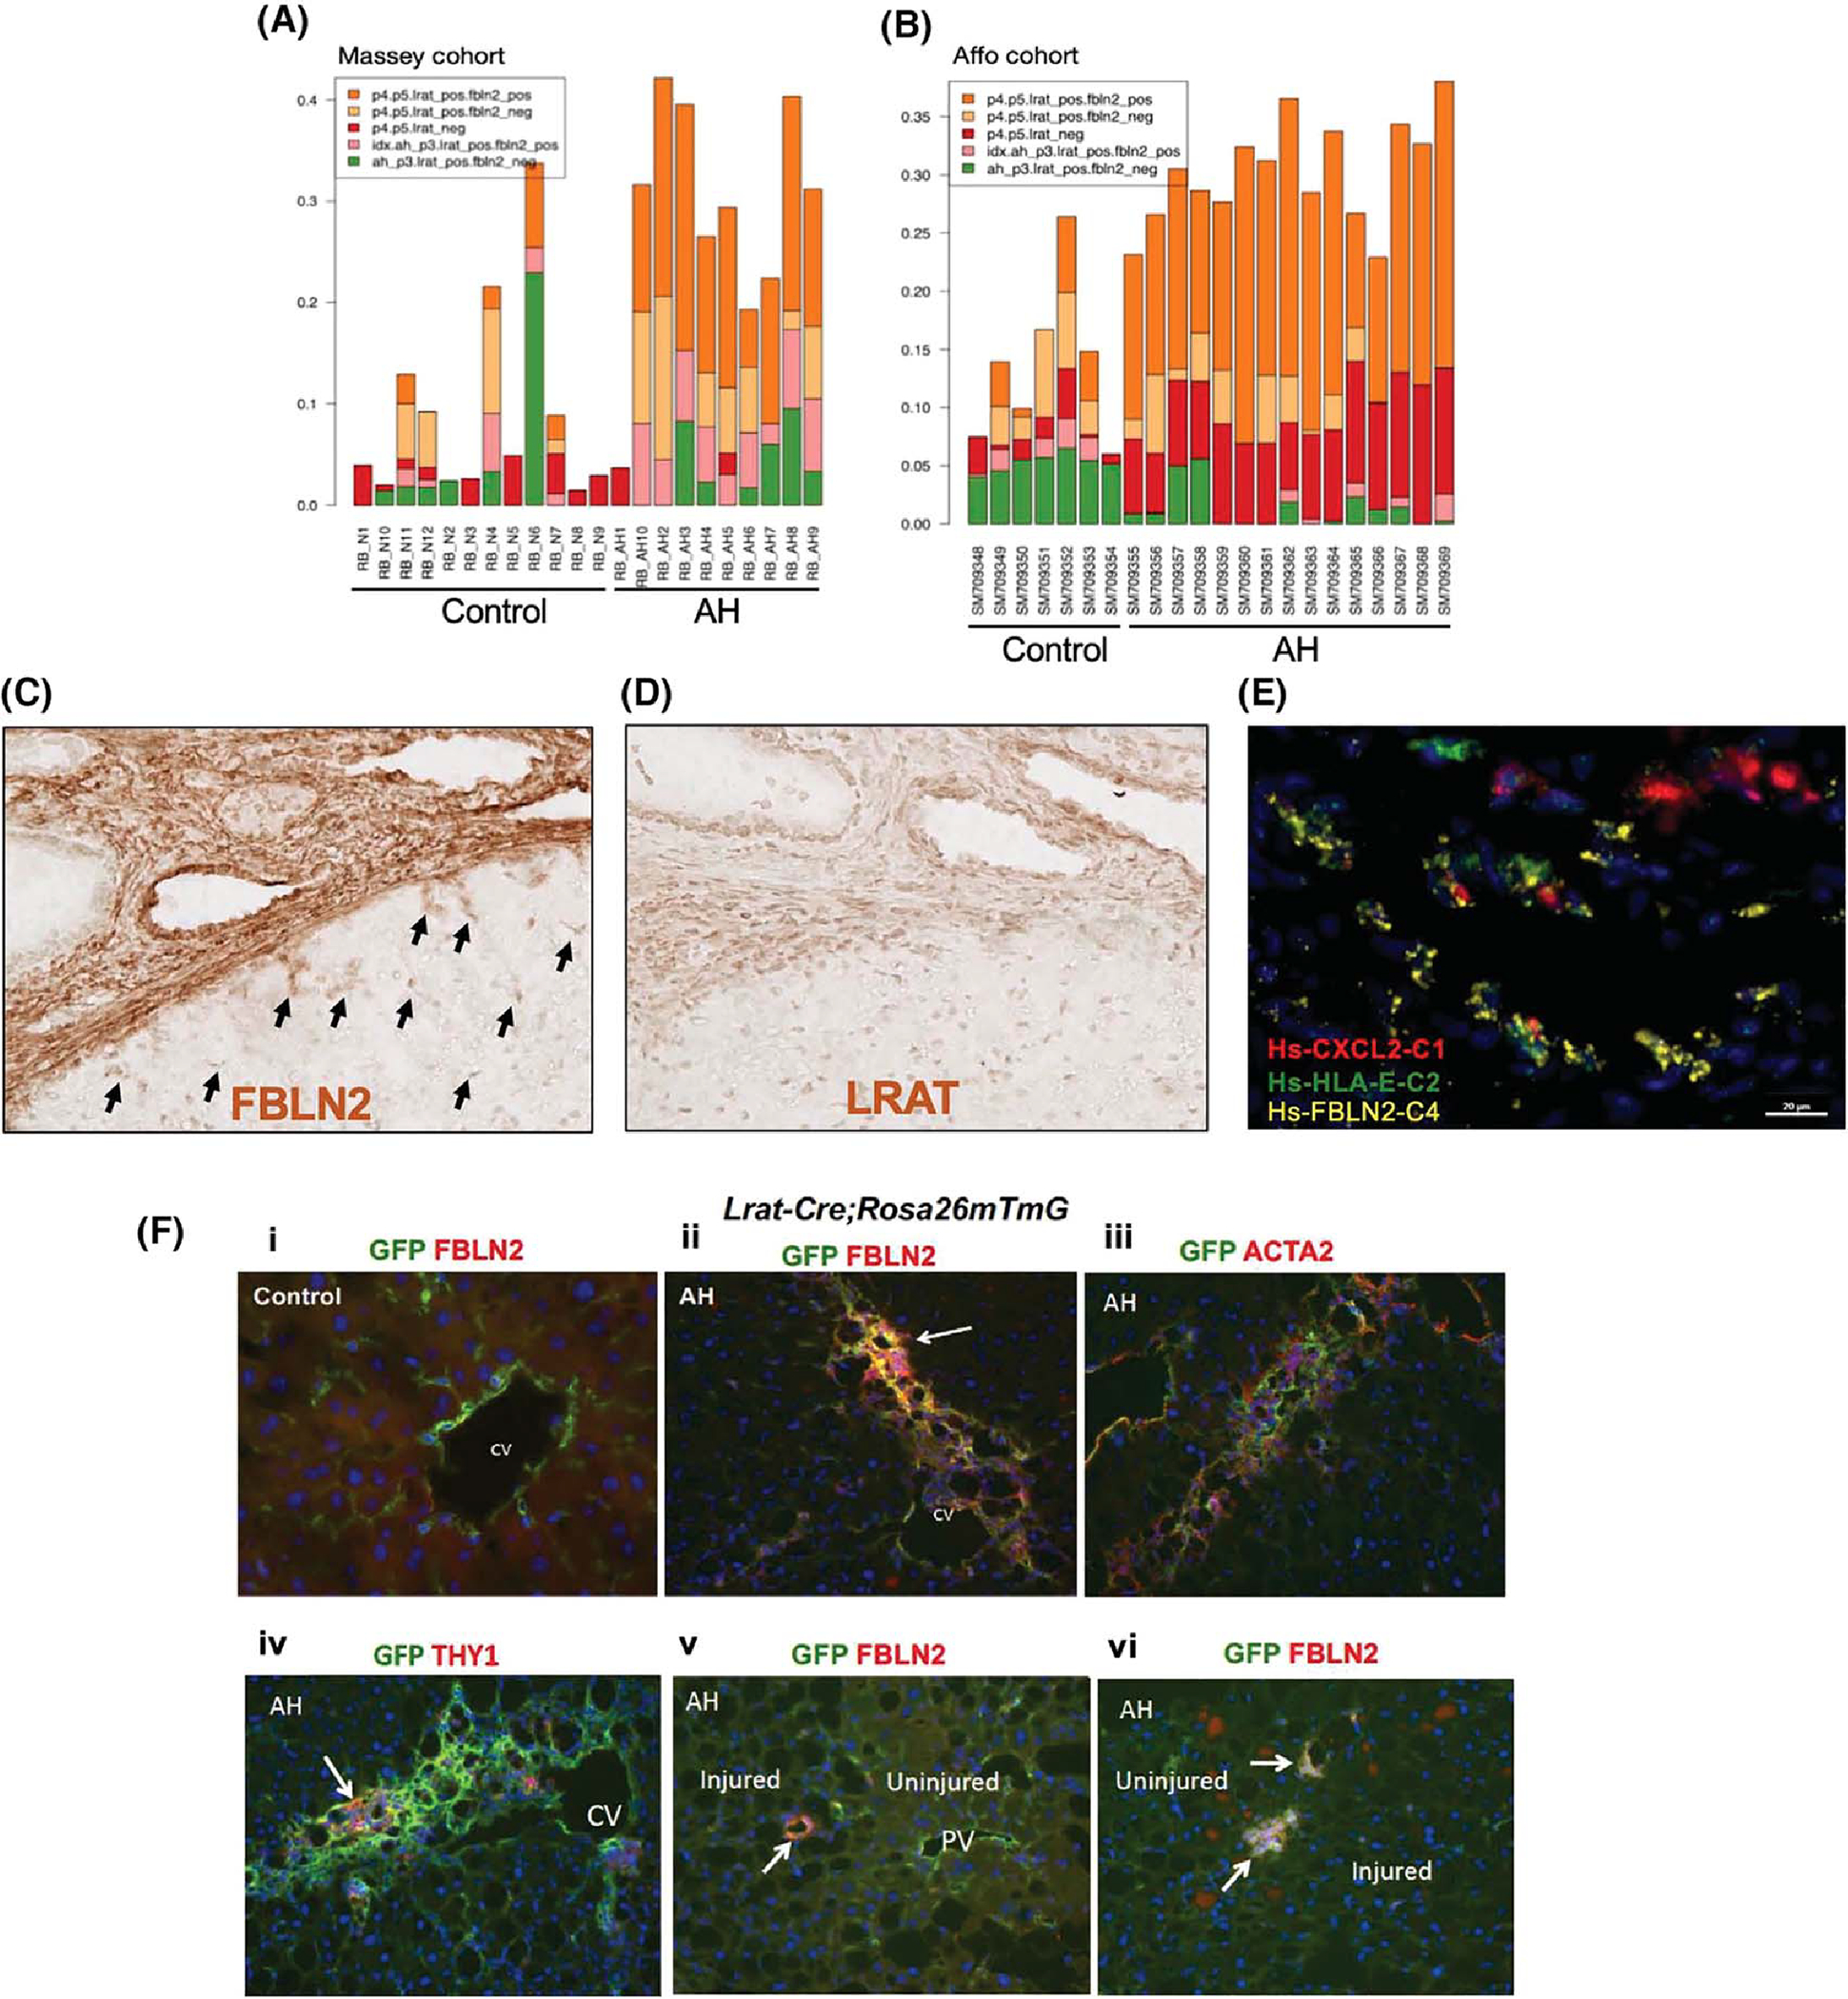
(A,B) The relative proportions of various HSC subpopulations inferred by their specific gene-expression programs represented in human normal and AH samples from the Massey cohort (A) or Affo cohort (B) as estimated by a computational deconvolution analysis of bulk liver RNA-seq data using the PERT algorithm. (C,D) Horseradish peroxidase (HRP) immunohistochemical (IHC) images (×20) of FBLN2 (C) and LRAT (D) staining of AH patient liver sections. Black arrows point to FBLN2+ star-shaped aHSCs. (E) Multiplex in situ hybridization (ISH) image of an AH patient liver section depicting FBLN2+ cells co-expressing chemokine (C-X-C motif) ligand 2 (CXCL2) and/or human leukocyte antigen E (HLA-E) (×62.5). (F) Double immunofluorescence (IF) staining microscopic images (×20) of Lrat-driven expression of GFP with FBLN2 (i, ii, v, vi), ACTA2 (iii), or THY1 (iv) in Lrat-Cre;Rosa26mTmG mouse subjected to the control (i) or AH (ii–vi) regimen. CV, central vein; PV, portal vein.