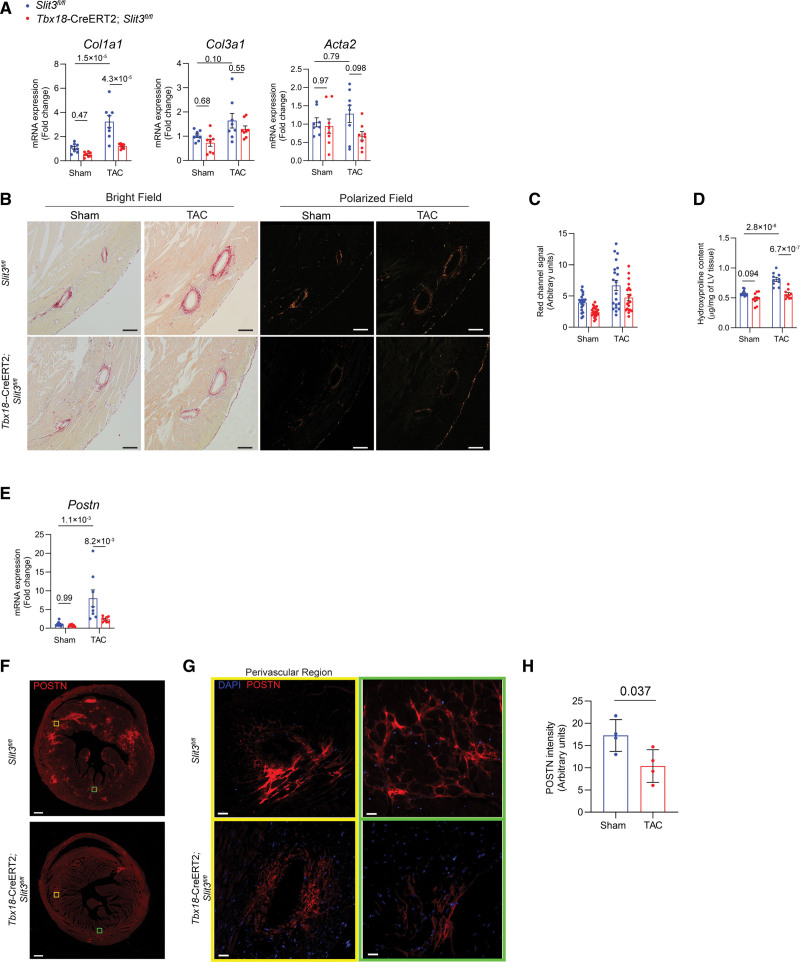
Figure 6.
Vascular mural cell–specific deletion of SLIT3 abrogates pressure overload–induced cardiac fibrosis. A, Quantitative PCR (qPCR) analysis of transcript levels of fibrosis-associated genes (Col1a1, Col3a1, and Acta2, normalized to Gapdh transcript levels) in hearts from Slit3fl/fl and Tbx18-CreERT2;Slit3fl/fl mice after sham or transverse aortic constriction (TAC) surgery. N=8 mice in each group. B, Picrosirius red staining of myocardial sections from Slit3fl/fl and Tbx18-CreERT2;Slit3fl/fl mice after sham or TAC surgery and visualized under brightfield microscopy and polarized light. Representative images are shown. Scale bar, 100 µm. C, Quantification of red channel signal under polarized light of picrosirius red–stained myocardial sections from (B). Data from N=4 animals/group with 4 high power fields analyzed per animal. D, Collagen content determination from left ventricle tissue using the hydroxyproline assay. Data from n=8 animals/group. E, Postn transcript levels in hearts from Slit3fl/fl and Tbx18-CreERT2;Slit3fl/fl mice after sham or TAC surgery. Data from N=8 animals/group. F and G, Representative images of post-TAC myocardial sections stained with an anti-POSTN (periostin) antibody (scale bar=500 µm in [F] and 25 µm in [G]). H, Quantification of POSTN stained myocardial sections in (F). N=4 mice in each group. Two-way ANOVA with the Tukey multiple comparisons test used in (A, D, and E). A linear regression model with cluster option was used to evaluate the data in (C), where the comparison of genotype (Slit3fl/fl vs Tbx18-CreER2;Slit3fl/lf) and surgery (sham vs TAC) were different (P<1.0×10⁻⁴ and P<1.0×10⁻⁴, respectively). The interaction between genotype and surgery was not significant (P=0.53). Two-tailed t test was used in (H), with data passing the Shapiro-Wilk normality test and assuming the application of the central limit theorem.

