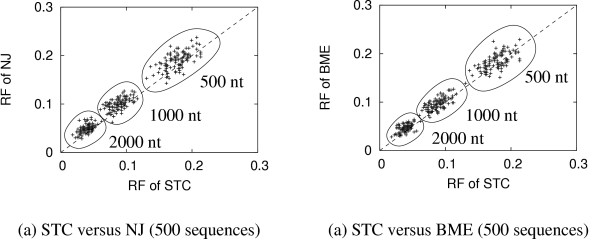
Figure 2.

The comparisons of topological accuracy between STC, NJ and BME for the rbcl simulation. Each point in the graph presents the Robinson and Foulds (RF) distance for a simulated data set. Points above the dotted line are examples where the RF distance of the STC-tree is less than the RF distance of the NJ-tree or BME-tree. Thus, the STC gives higher topological accuracy than NJ or BME with respect to the simulated data set.
